Introduction to Performance Tips
Introduction
Writing SQL that works is one thing. Writing SQL that works fast is another. As your data grows from thousands of rows to millions or even billions, poorly written queries can take minutes instead of milliseconds. The difference between a junior and senior SQL developer often comes down to knowing how to write efficient queries.
In this tutorial, you will learn:
- Why SQL performance matters in real-world applications
- The most common causes of slow queries
- The general mindset for writing efficient SQL
- An overview of what we will cover in the Performance Best Practices section
- How to think about query optimization systematically
Why Performance Matters
In a small database with a few hundred rows, almost any query runs instantly. But real production databases are a different world:
| Environment | Typical Size | Tolerance for Slow Queries |
|---|---|---|
| Learning/Tutorial | Hundreds of rows | Any query is fast |
| Small Business App | Thousands of rows | Seconds are acceptable |
| Medium Enterprise | Millions of rows | Must respond in < 1 second |
| Large Enterprise | Hundreds of millions | Must respond in < 100ms |
| Big Data / Analytics | Billions of rows | Requires specialized strategies |
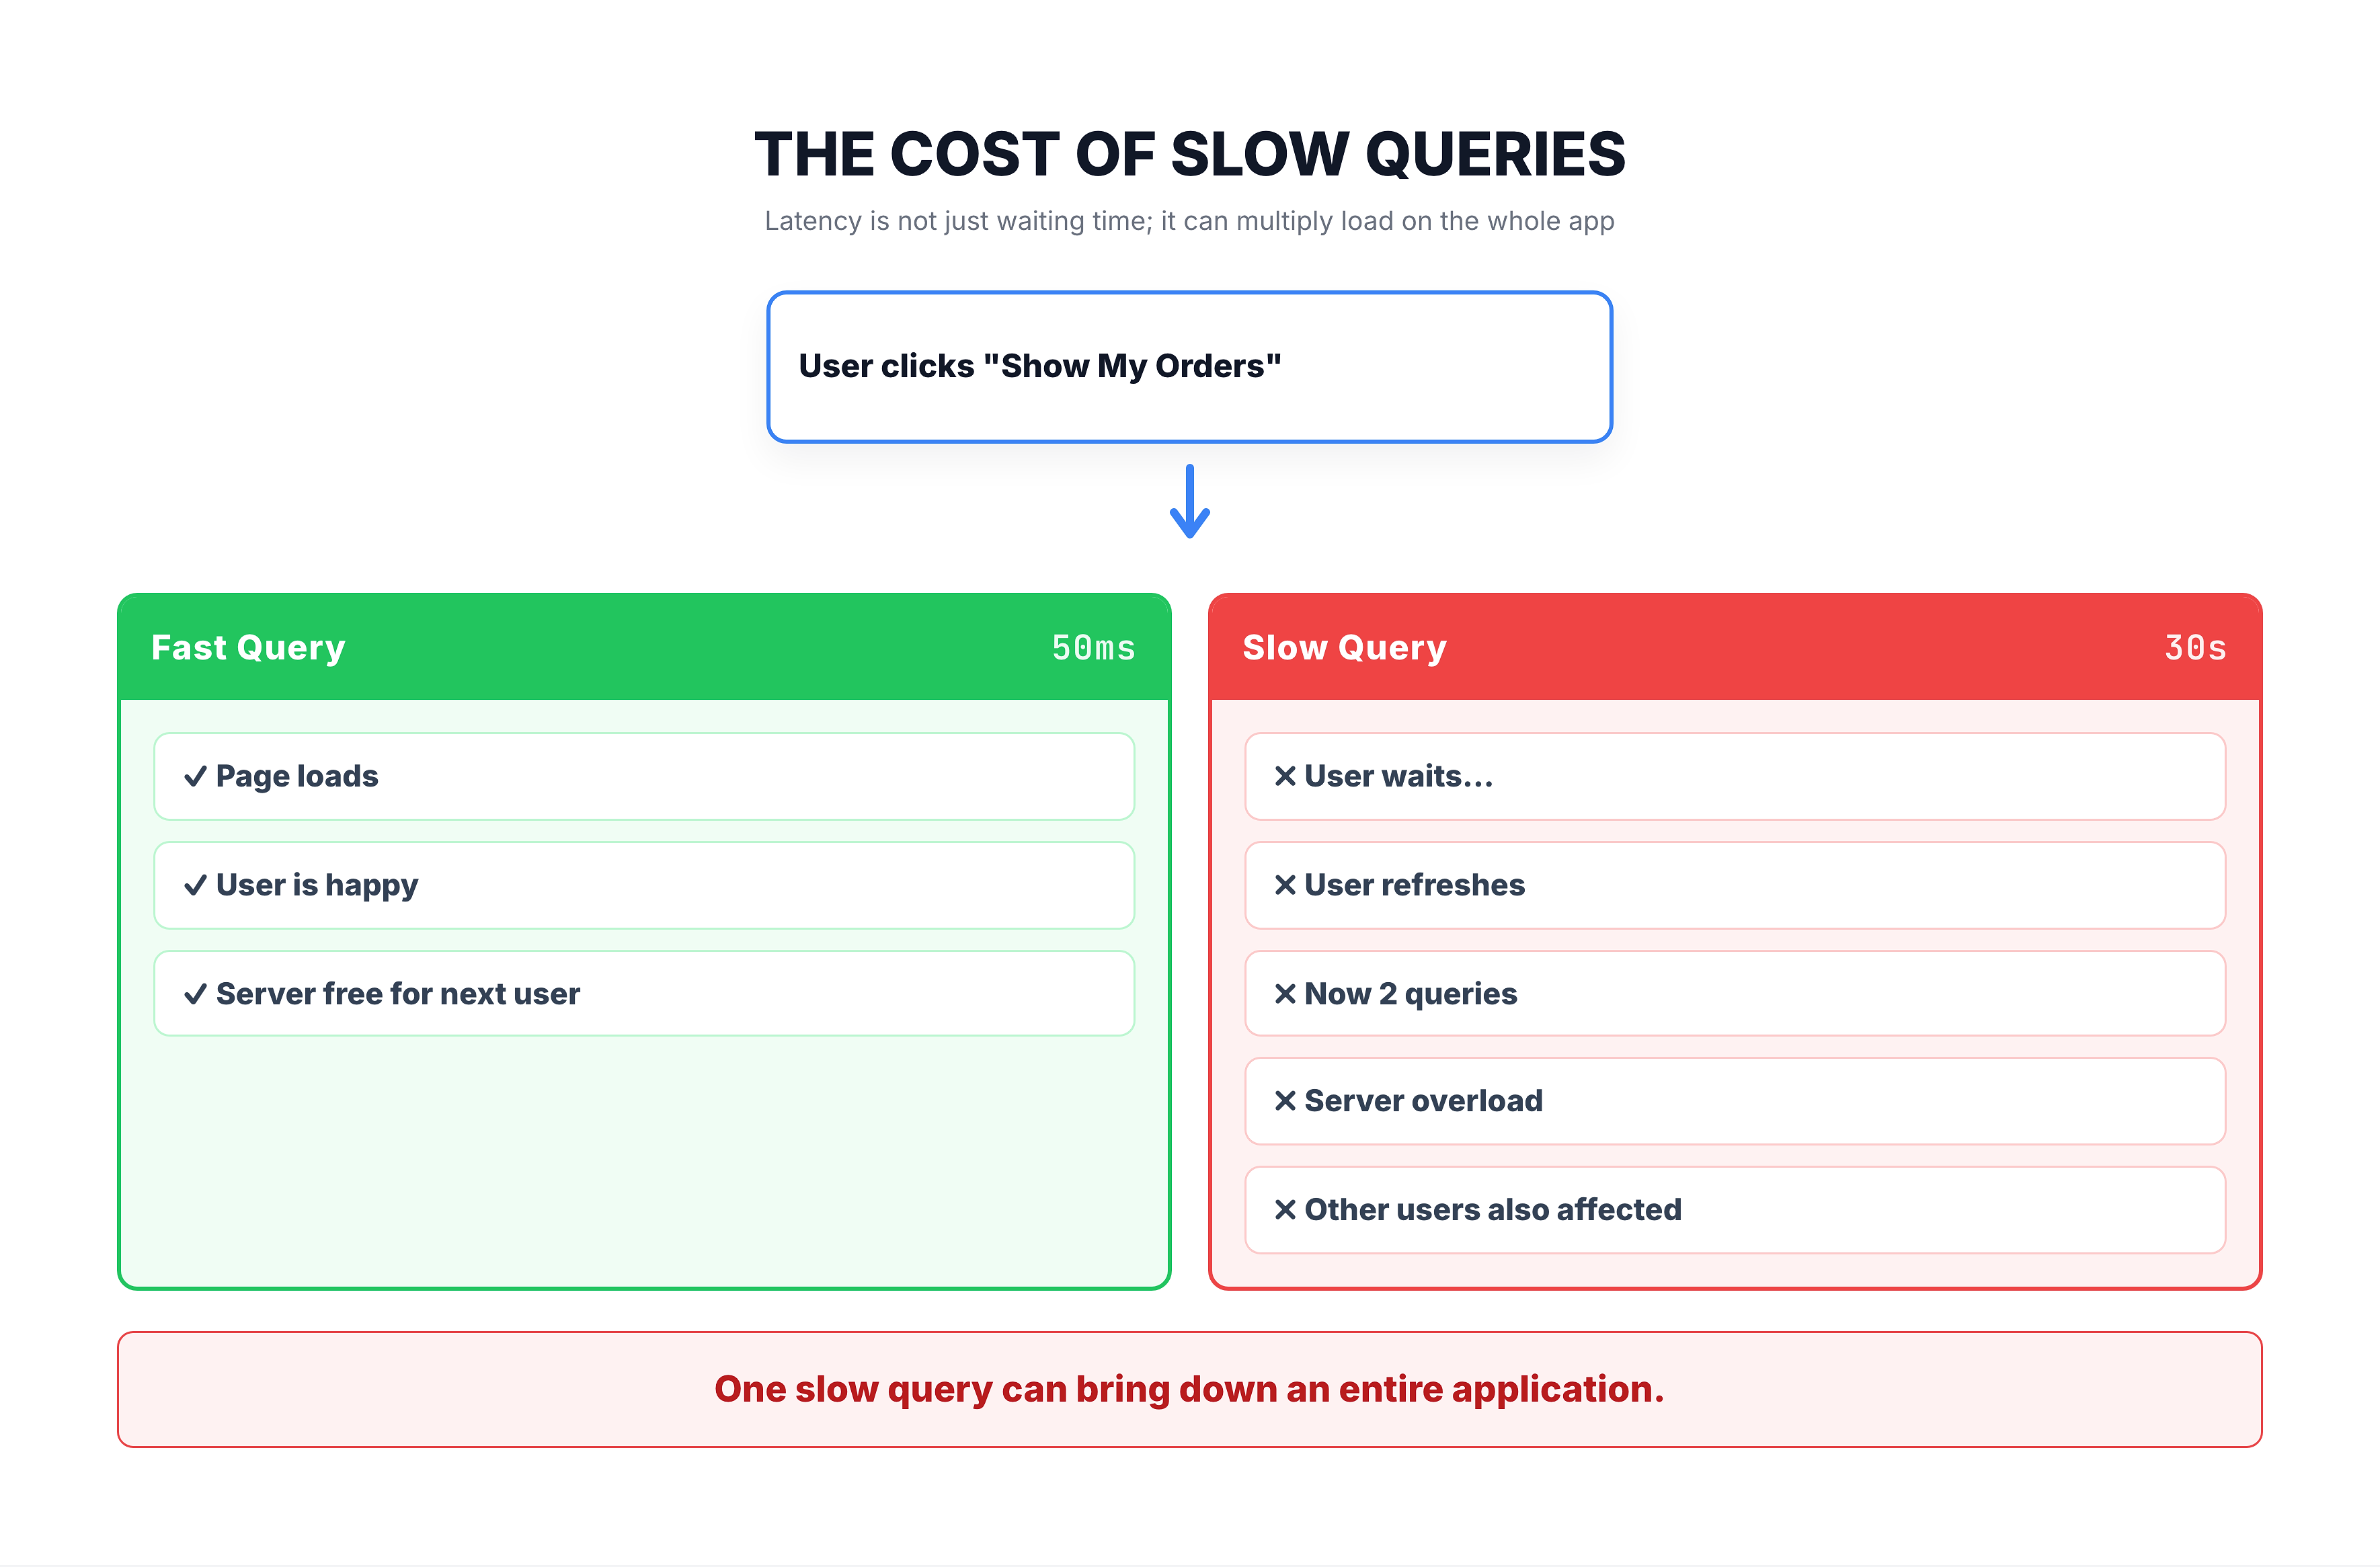
When a query takes too long, the consequences cascade:
- User experience degrades — pages take seconds to load, users leave
- Server resources are consumed — slow queries hold locks, block other queries
- Costs increase — more CPU, memory, and disk I/O means higher cloud bills
- Timeouts occur — applications give up waiting and show errors
Common Causes of Slow Queries
Before diving into specific optimization techniques, it helps to understand the most frequent reasons queries run slowly:
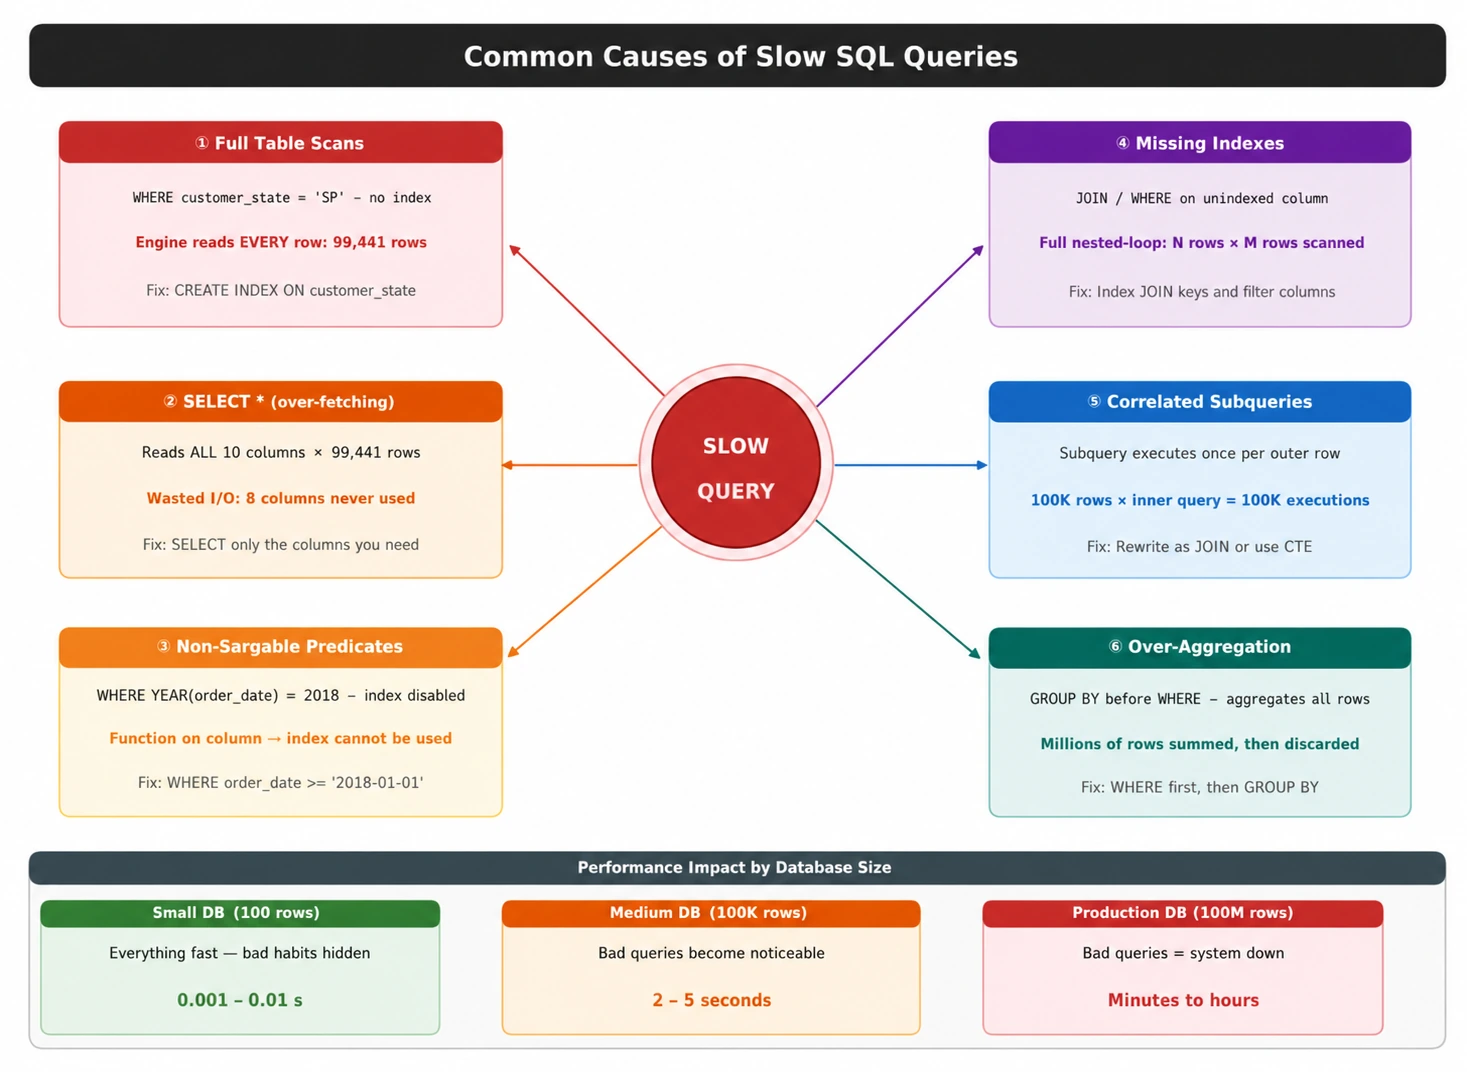
1. Fetching Too Much Data
The most common performance mistake is retrieving more data than you need. Using SELECT * when you only need two columns forces the database to read and transfer unnecessary data.
2. Missing or Incorrect Indexes
Without proper indexes, the database must scan every row in a table to find matching data. This is called a full table scan, and it gets slower as the table grows.
3. Inefficient Filtering
Putting functions on columns in WHERE clauses, using leading wildcards in LIKE patterns, or writing non-sargable predicates prevents the database from using indexes effectively.
4. Poor Join Strategies
Joining large tables without proper indexes on the join columns, joining more tables than necessary, or using the wrong type of join can multiply the work the database must do.
5. Suboptimal Aggregations
Grouping by high-cardinality columns, aggregating before filtering, or performing unnecessary calculations inside aggregate functions wastes resources.
6. Unnecessary Subqueries
Using correlated subqueries that execute once per row in the outer query, or nesting subqueries deeply, can turn a simple query into an exponentially slow one.
The Performance Mindset
Optimizing SQL is not about memorizing tricks. It is about developing a systematic way of thinking:
Think Like the Database Engine
Every time you write a query, imagine you are the database engine. Ask yourself:
- How much data do I need to read? — Can I reduce it?
- Can I use an index? — Or am I forcing a full table scan?
- Am I doing unnecessary work? — Sorting, grouping, or computing things I do not need?
- Am I reading the same data multiple times? — Can I restructure the query?
The Optimization Hierarchy
When trying to improve a slow query, follow this priority order:
| Priority | Action | Impact |
|---|---|---|
| 1 | Reduce data volume — fetch only what you need | Highest |
| 2 | Add proper indexes — let the engine find data fast | High |
| 3 | Rewrite the query — use better SQL patterns | High |
| 4 | Adjust database design — denormalize, partition | Medium |
| 5 | Tune server settings — memory, parallelism | Low |
| 6 | Upgrade hardware — more CPU, faster disks | Last resort |
Always start from the top. Adding more hardware to compensate for a bad query is like buying a faster car because you keep taking the wrong route — the right route is always better.
Write Minimal SQL
The best-performing query is the one that does the least amount of work to produce the correct result. Every column you select, every row you scan, every join you add, and every sort you request has a cost. Your goal is to minimize that total cost.
What We Will Cover
This Performance Best Practices section is organized around the major SQL operations you have already learned. For each operation, we will identify the most common mistakes and show you how to fix them:
| Tutorial | Topics Covered |
|---|---|
| Performance Tips for Fetching Data | SELECT *, column selection, LIMIT, data types |
| Performance Tips for Filtering | Sargable predicates, function-free WHERE clauses, data type matching |
| Performance Tips for Joining | Join order, index placement, reducing join scope |
| Performance Tips for Aggregation | Filter before aggregating, efficient GROUP BY, HAVING vs WHERE |
| Performance Tips for Subqueries | Correlated vs non-correlated, EXISTS vs IN, replacing with JOINs |
| Performance Tips for Table DDL | Choosing data types, normalization trade-offs, temp tables |
| Performance Tips for Indexing | Index strategy recap, covering indexes, index maintenance |
| Performance Tips Summary | Complete checklist and quick reference |
Each tutorial will follow a consistent pattern:
- Show the slow version — the common mistake
- Explain why it is slow — what the database engine is doing
- Show the fast version — the optimized approach
- Measure the difference — quantify the improvement
How to Measure Query Performance
Before optimizing, you need to know how to measure. Here are the primary tools:
Execution Plan
The execution plan shows you exactly how the database engine processes your query — which tables it scans, which indexes it uses, and where the most time is spent.
Key Metrics to Watch
| Metric | What It Tells You | Good Value |
|---|---|---|
| Logical Reads | Number of data pages read from memory | Lower is better |
| Physical Reads | Number of data pages read from disk | Should be 0 for cached data |
| Elapsed Time | Total wall-clock time | Depends on context |
| CPU Time | Time spent on computation | Lower is better |
| Row Count | Number of rows processed | Should match what you need |
| Scan Count | Number of times a table was scanned | 1 is ideal, 0 for seeks |
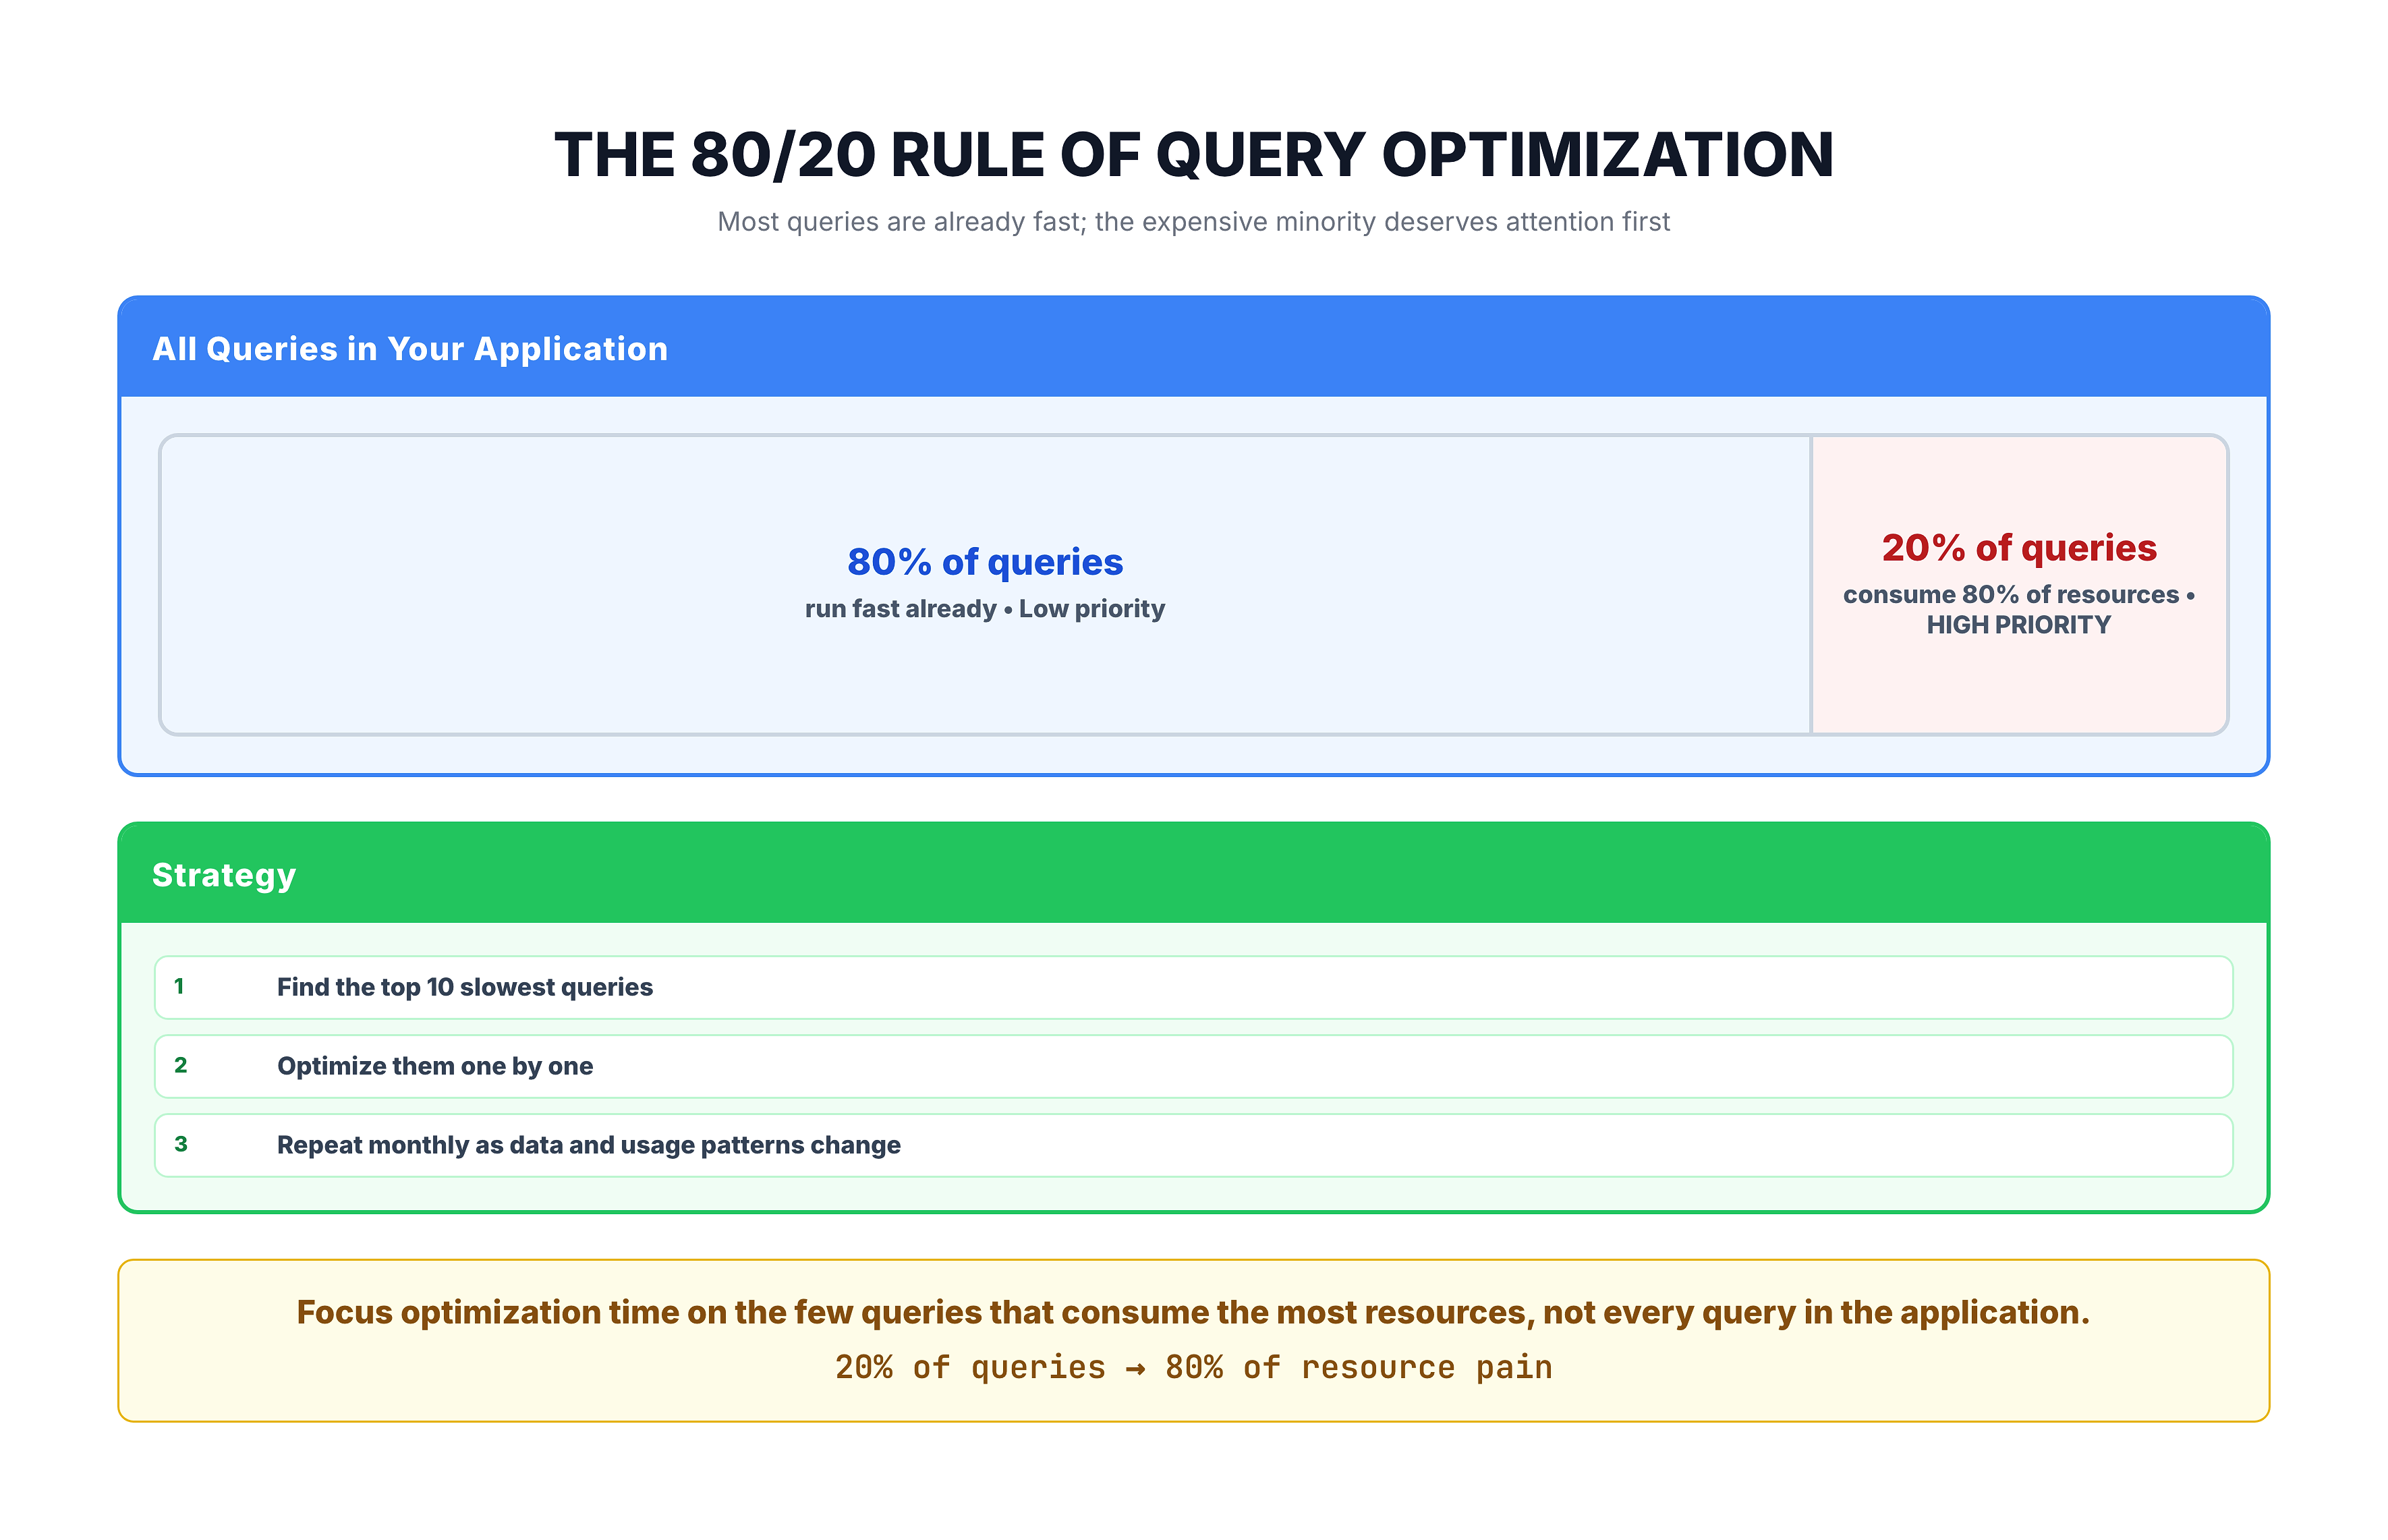
The 80/20 Rule
In most databases, 20% of the queries consume 80% of the resources. Focus your optimization efforts on the most expensive queries first — they will give you the biggest return on investment.
Summary
Here is what you should take away from this introduction:
| Concept | Key Takeaway |
|---|---|
| Why it matters | Slow queries degrade user experience, waste resources, and increase costs |
| Common causes | SELECT *, missing indexes, bad WHERE clauses, inefficient joins, correlated subqueries |
| Mindset | Think like the database engine — minimize the work required |
| Priority | Reduce data first, add indexes second, rewrite queries third |
| Measurement | Always measure before and after — use execution plans and I/O statistics |
| 80/20 rule | Focus on the most expensive queries for the biggest impact |
In the following tutorials, we will dive deep into specific optimization techniques for each type of SQL operation. Each tutorial will give you practical, actionable tips that you can apply immediately to your own queries.