Execution Plan
Introduction
An execution plan is the blueprint SQL Server creates for running your query. It shows exactly which indexes are used, how tables are joined, and where the most expensive operations happen. Understanding execution plans is essential for performance tuning.
In this tutorial, you will learn:
- What an execution plan is
- The difference between estimated and actual plans
- How to read the most common operators
- How to identify performance bottlenecks
- How the query optimizer makes decisions
Estimated vs Actual Execution Plans
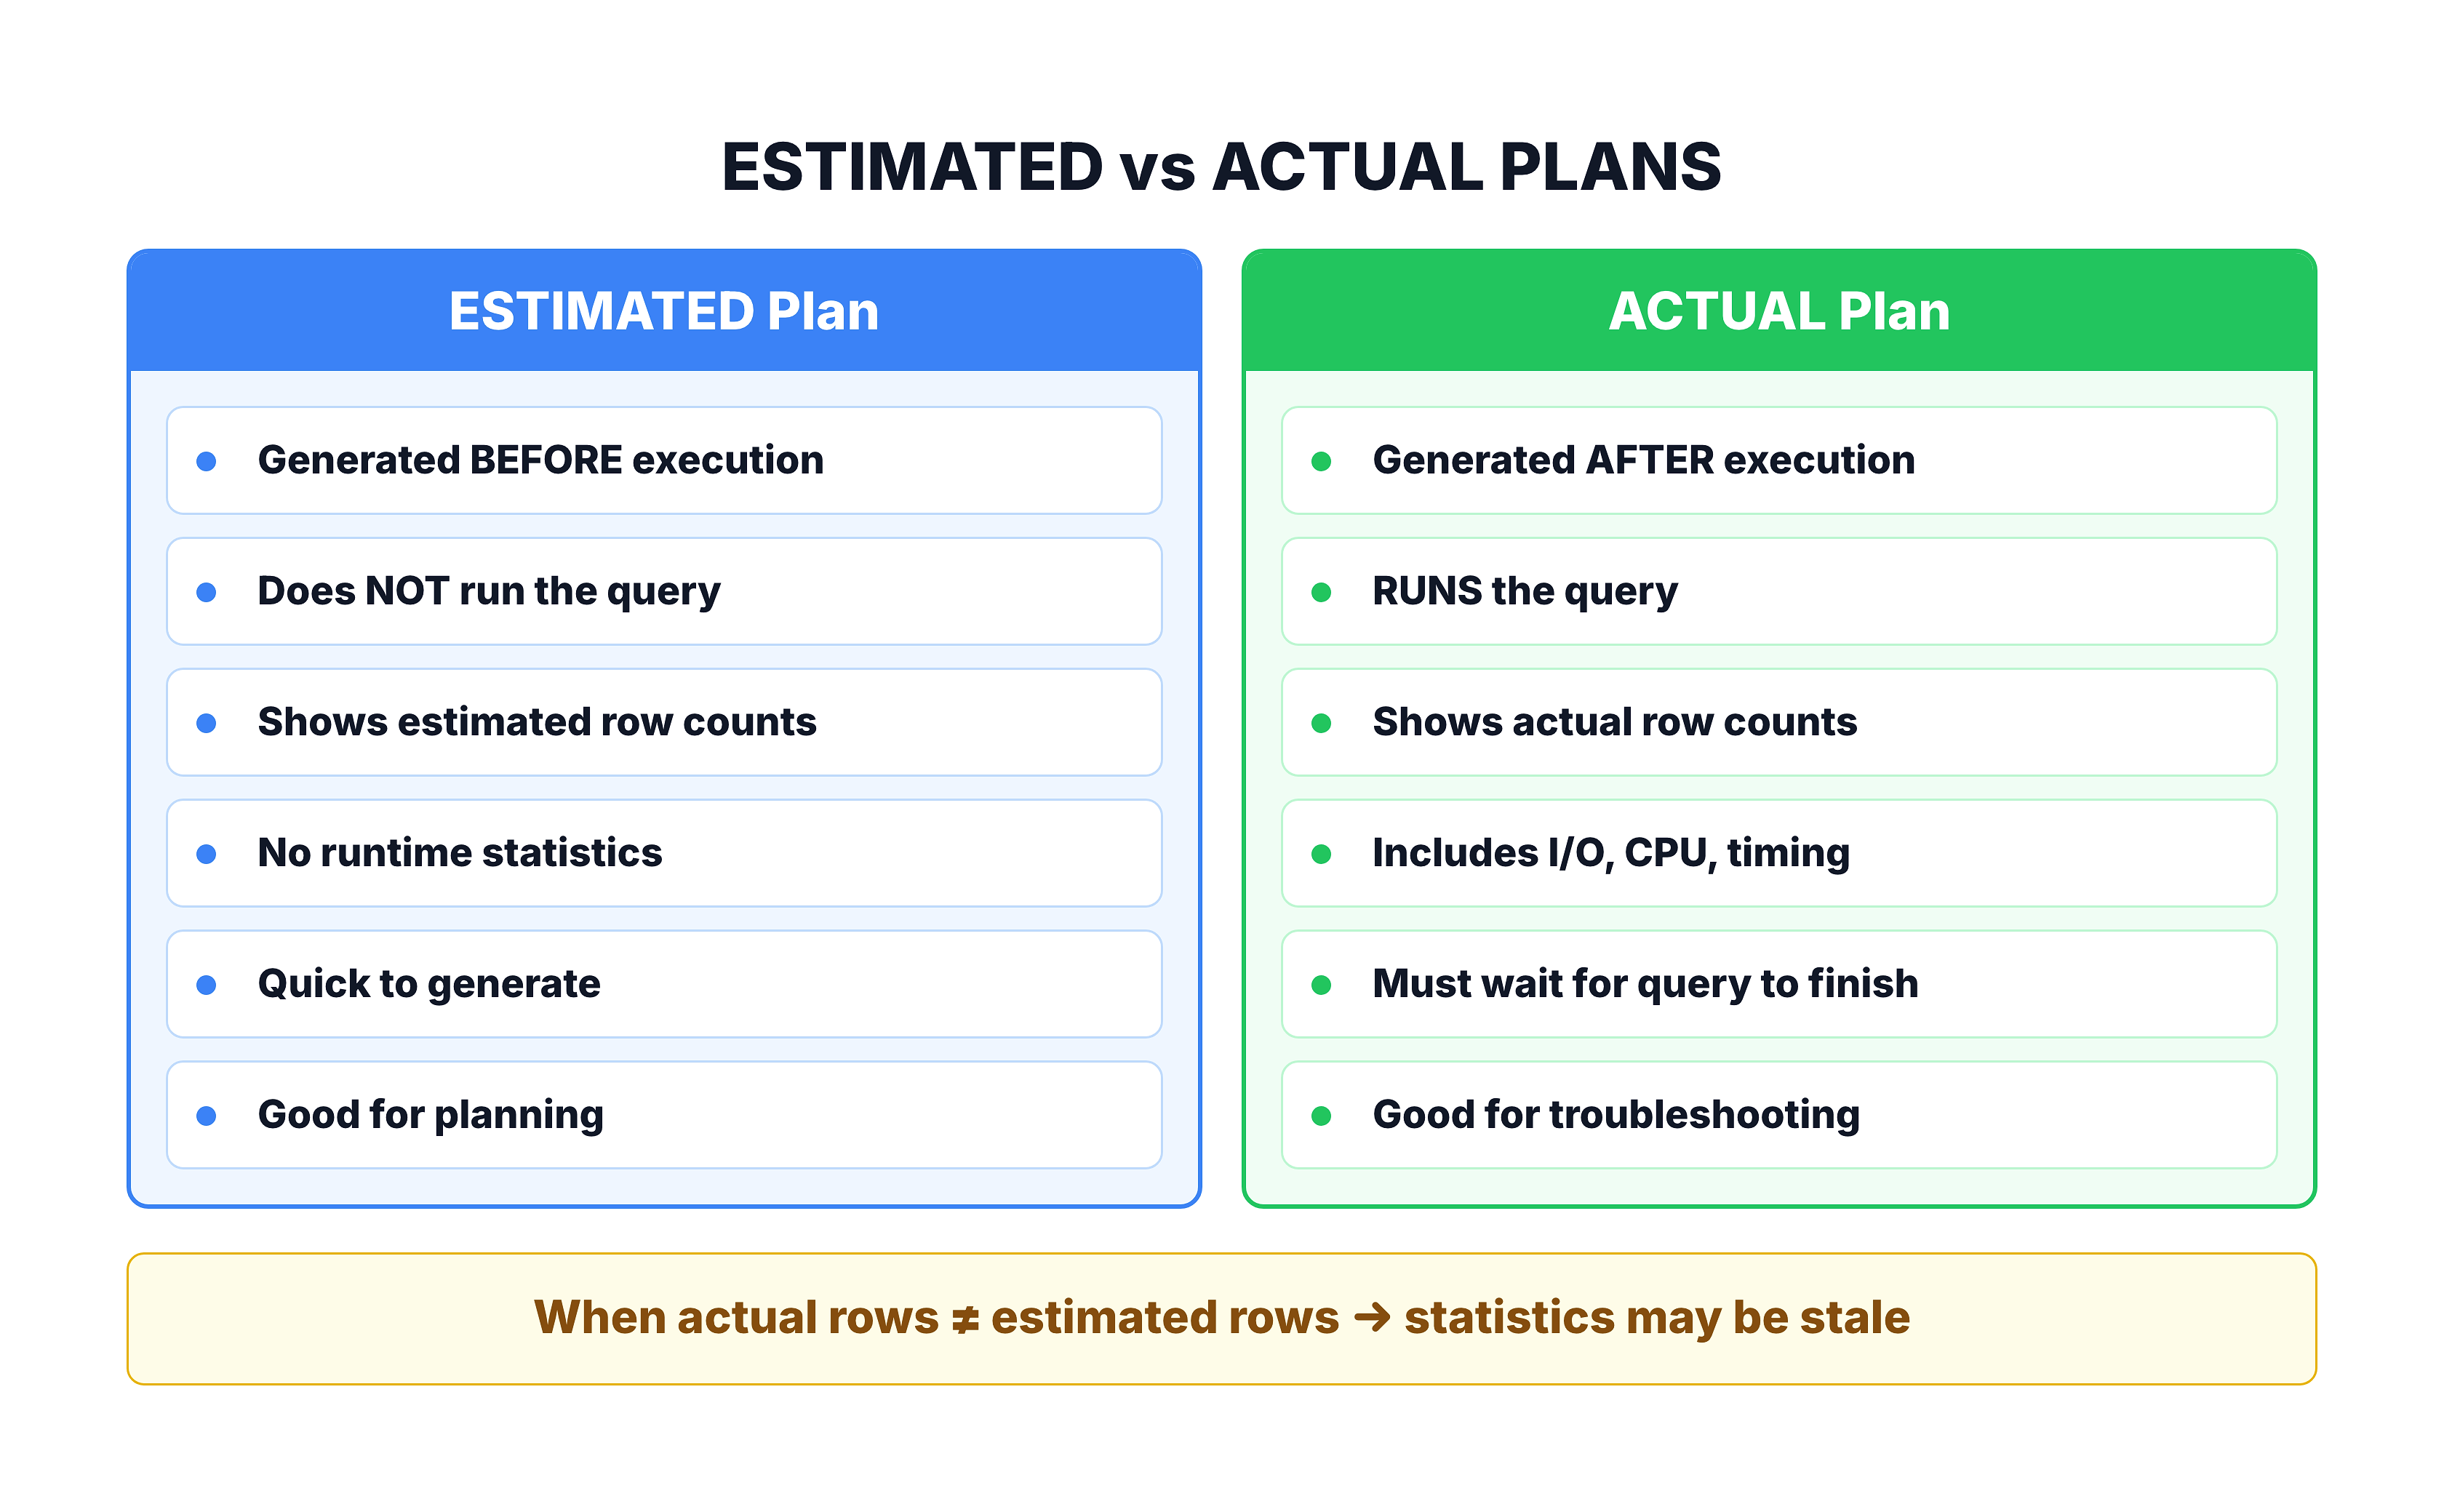
SQL Server provides two types of execution plans:
-- Get estimated execution plan (does NOT execute)
SET SHOWPLAN_XML ON;
GO
SELECT * FROM orders WHERE order_status = 'delivered';
GO
SET SHOWPLAN_XML OFF;
GO

-- Get actual execution plan (DOES execute)
SET STATISTICS XML ON;
GO
SELECT * FROM orders WHERE order_status = 'delivered';
GO
SET STATISTICS XML OFF;
GO

-- Get text-based estimated plan
SET SHOWPLAN_TEXT ON;
GO
SELECT * FROM orders WHERE order_status = 'delivered';
GO
SET SHOWPLAN_TEXT OFF;
GOTip: In SQL Server Management Studio, you can also press Ctrl+L for the estimated plan or click Include Actual Execution Plan before running your query.
Common Operators
Execution plans are made up of operators. Here are the most common ones you will see:
Data Access Operators
| Operator | Description | Performance |
|---|---|---|
| Clustered Index Seek | Navigates B-tree to find specific rows | ✅ Best — O(log n) |
| Clustered Index Scan | Reads entire clustered index | ⚠️ Expensive on large tables |
| NonClustered Index Seek | Navigates NC index B-tree | ✅ Excellent |
| NonClustered Index Scan | Reads entire NC index | ⚠️ Depends on index width |
| Table Scan | Reads entire heap (no clustered index) | ❌ Usually bad |
| Key Lookup | Follows pointer from NC index to clustered index | ⚠️ Expensive in bulk |
| RID Lookup | Follows pointer from NC index to heap | ⚠️ Expensive in bulk |
Join Operators
| Operator | Best For | How It Works |
|---|---|---|
| Nested Loops | Small outer + indexed inner | For each outer row, seek inner |
| Hash Match | Large unsorted inputs | Builds hash table, probes it |
| Merge Join | Large pre-sorted inputs | Walks both inputs in order |
Other Common Operators
| Operator | Description |
|---|---|
| Sort | Sorts data (expensive if not already sorted by index) |
| Filter | Applies WHERE conditions after retrieval |
| Compute Scalar | Calculates expressions |
| Stream Aggregate | Groups pre-sorted data |
| Hash Aggregate | Groups unsorted data using hash table |
| Parallelism | Distributes/gathers work across threads |
Reading the Plan
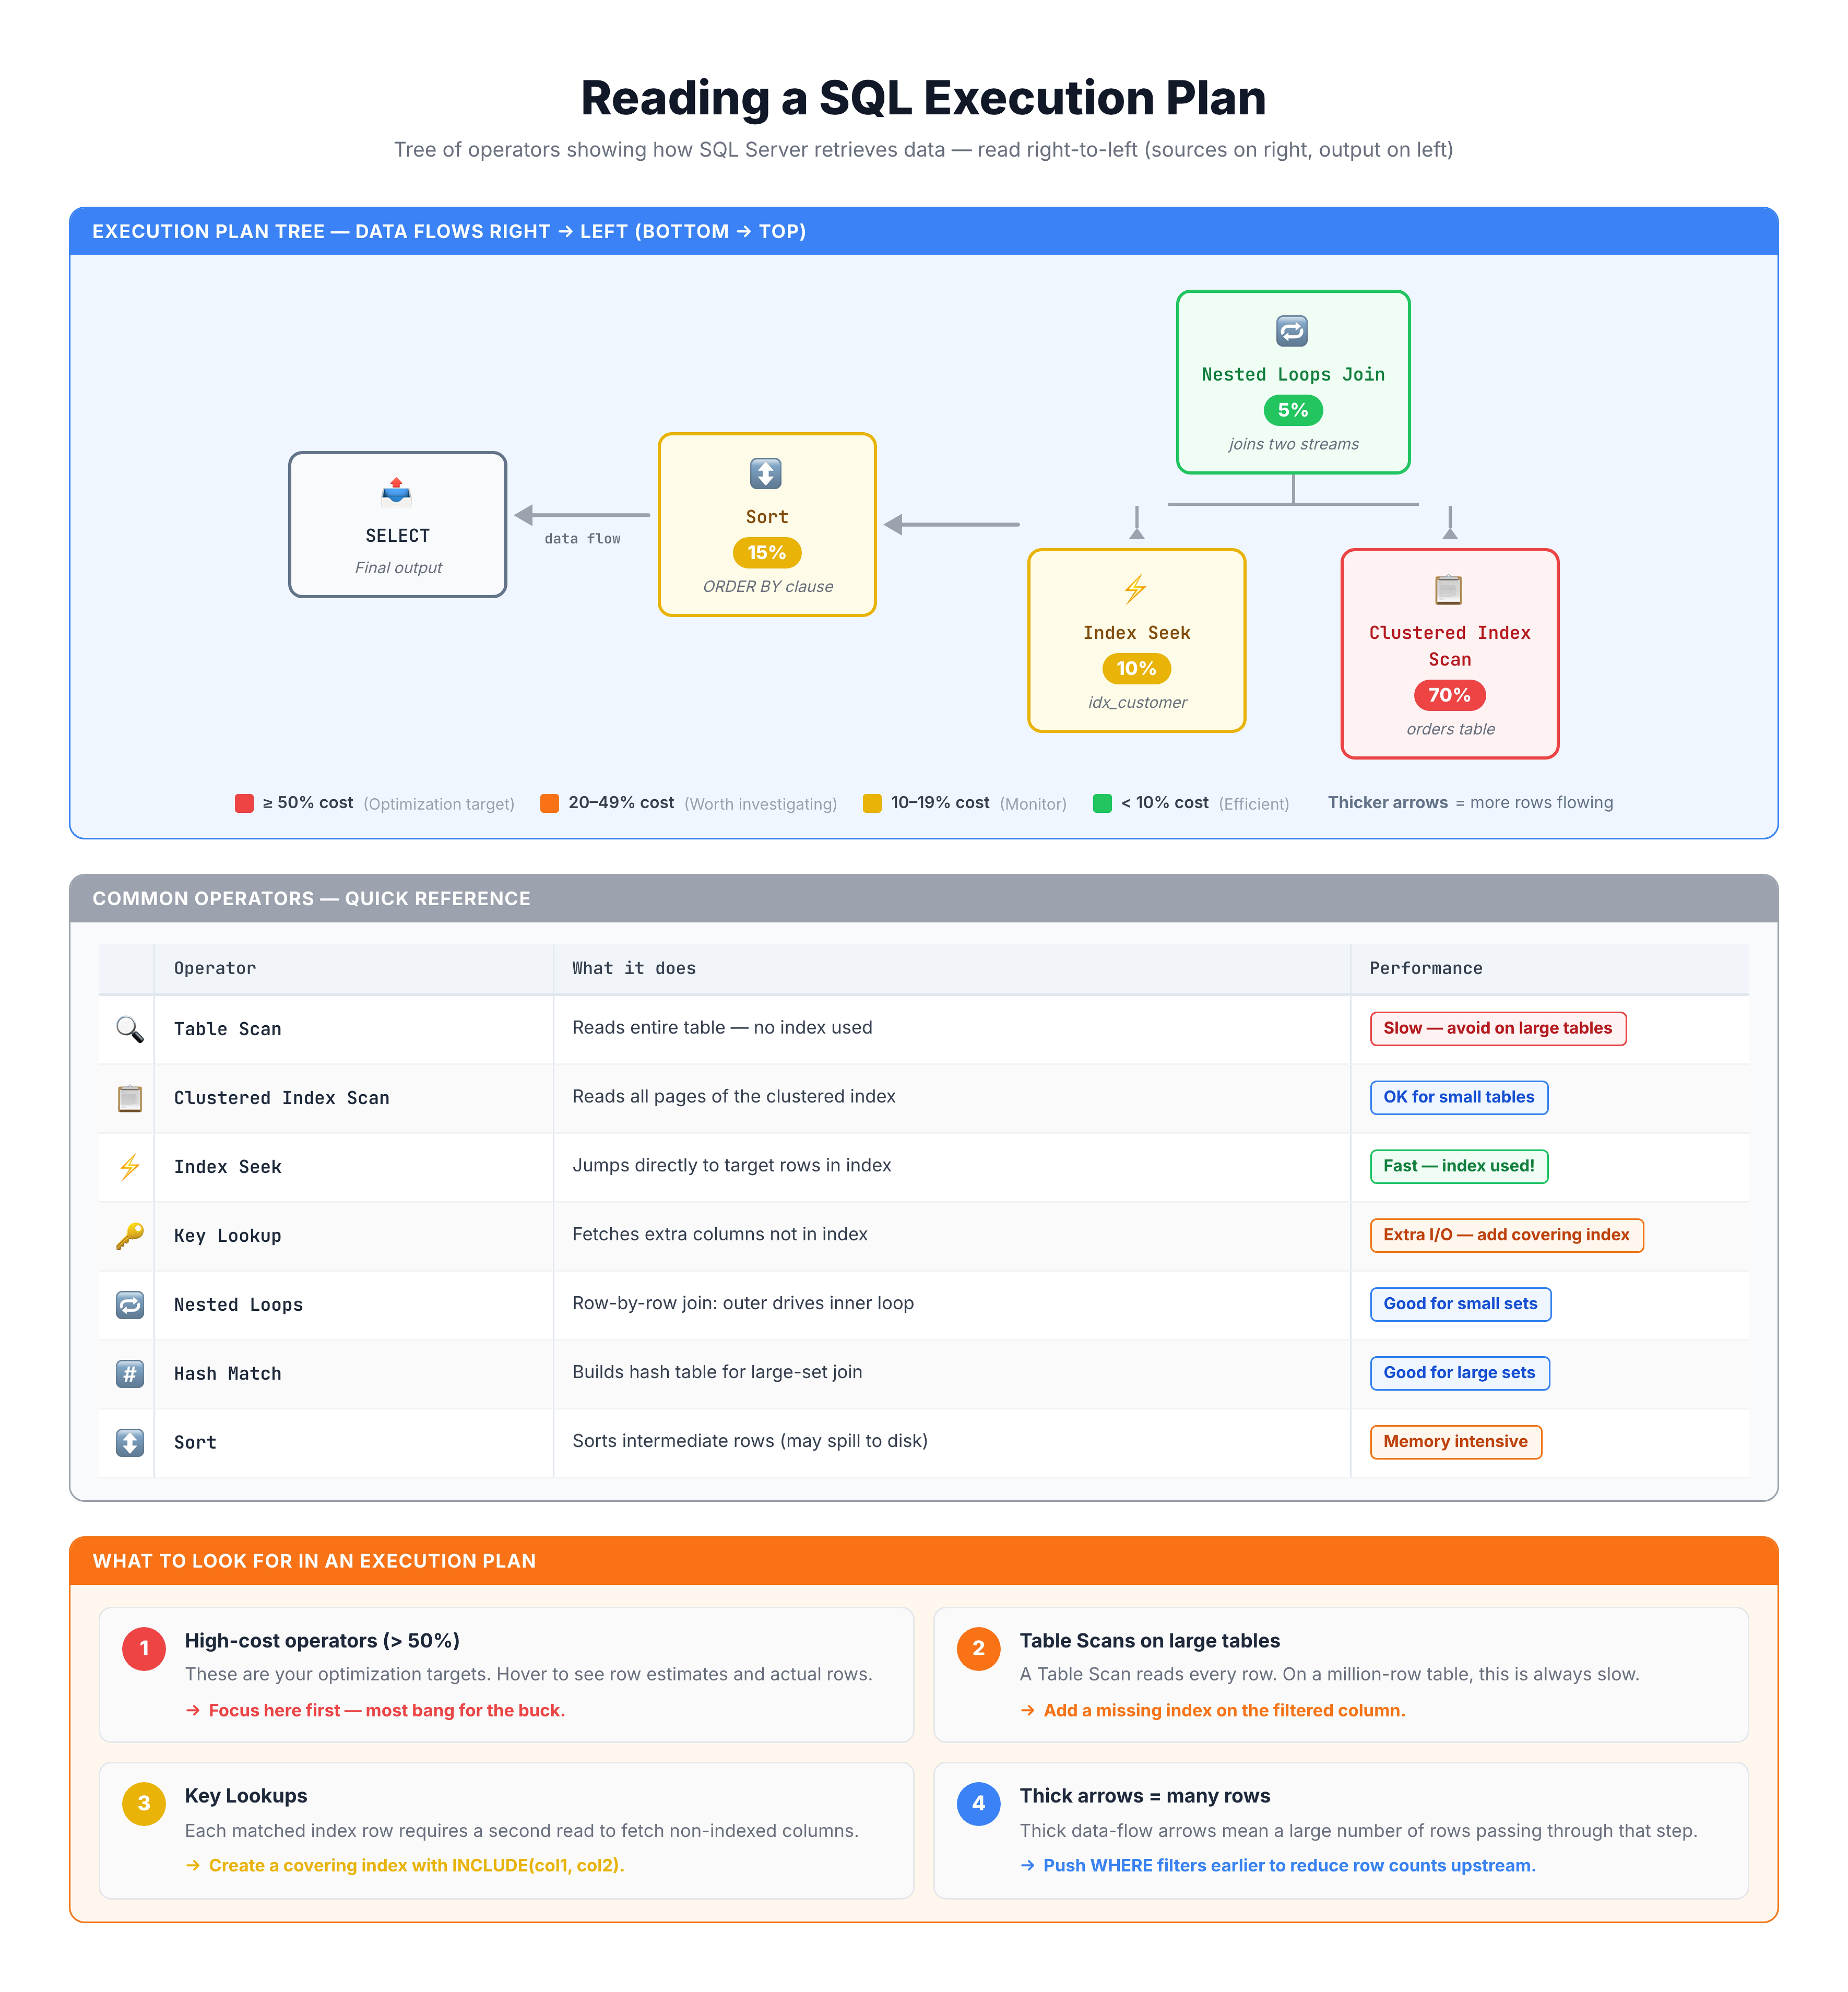
Execution plans are read right to left, bottom to top. Data flows from the leaf operators (right side) toward the final SELECT (left side).
Using SET STATISTICS for Performance Data
Beyond the graphical plan, you can get detailed I/O and timing information using SET STATISTICS.
-- Show logical and physical reads per table
SET STATISTICS IO ON;

-- Show CPU and elapsed time
SET STATISTICS TIME ON;

SELECT
    o.order_id,
    o.order_status,
    c.customer_city
FROM orders o
JOIN customers c ON o.customer_id = c.customer_id
WHERE o.order_status = 'delivered';

SET STATISTICS IO OFF;
SET STATISTICS TIME OFF;
Interpreting STATISTICS IO Output
Table 'orders'. Scan count 1, logical reads 245, physical reads 3
Table 'customers'. Scan count 1, logical reads 89, physical reads 0
| Metric | Meaning |
|---|---|
| Scan count | Number of scans/seeks on the table |
| Logical reads | Pages read from memory (buffer cache) |
| Physical reads | Pages read from disk (not in cache) |
| Read-ahead reads | Pages prefetched from disk |
Goal: Minimize logical reads. Compare before and after adding an index to see the improvement.
Identifying Performance Bottlenecks
Red Flags in Execution Plans
| Red Flag | What It Means | How to Fix |
|---|---|---|
| Table Scan / Clustered Index Scan | No useful index for the query | Add an appropriate index |
| Key Lookup (high cost) | NC index found rows but needs more columns | Add INCLUDE columns |
| Sort operator | Data not pre-sorted by an index | Add index matching ORDER BY |
| Hash Match for small joins | Optimizer chose hash because no index | Add index on join column |
| Thick arrows | Many rows flowing between operators | Check if filters can reduce rows earlier |
| Estimated ≠ Actual rows | Stale statistics | UPDATE STATISTICS |
| Parallelism (yellow) | Query too expensive for single thread | May be normal, or query needs tuning |
| Warning icons | Missing stats, implicit conversions, etc. | Address the specific warning |
The Arrow Thickness Rule
In graphical plans, the thickness of arrows between operators represents the number of rows flowing. Thick arrows mean lots of data. Look for places where a thick arrow suddenly becomes thin — that is where filtering is happening. Ideally, filtering should happen as early (as far right) as possible.
Comparing Plans Before and After an Index
The best way to validate an index is to compare execution plans.
-- Step 1: Get the plan WITHOUT the index
SET STATISTICS IO ON;
SET STATISTICS TIME ON;

SELECT order_id, order_status, order_purchase_timestamp
FROM orders
WHERE order_status = 'shipped'
  AND order_purchase_timestamp >= '2018-01-01';
-- Note: Table Scan, logical reads = 500+

-- Step 2: Create the index
CREATE NONCLUSTERED INDEX IX_Orders_Status_Date
ON orders (order_status, order_purchase_timestamp)
INCLUDE (order_id);

-- Step 3: Get the plan WITH the index
SELECT order_id, order_status, order_purchase_timestamp
FROM orders
WHERE order_status = 'shipped'
  AND order_purchase_timestamp >= '2018-01-01';
-- Note: Index Seek, logical reads = 5

SET STATISTICS IO OFF;
SET STATISTICS TIME OFF;| Metric | Before Index | After Index |
|---|---|---|
| Operator | Clustered Index Scan | NonClustered Index Seek |
| Logical reads | 500+ | 5 |
| Estimated rows | All rows | Only matching rows |
| Key Lookup | N/A | None (covered by INCLUDE) |
Summary
Here is what you learned in this tutorial:
| Concept | Key Points |
|---|---|
| Estimated plan | Generated before execution — no actual row counts |
| Actual plan | Generated after execution — includes runtime stats |
| Read direction | Right to left, bottom to top |
| Index Seek | Best access method — navigates B-tree directly |
| Index Scan | Reads entire index — often a sign of missing index |
| Key Lookup | Expensive extra step — fix with INCLUDE columns |
| STATISTICS IO | Shows logical/physical reads per table |
| Thick arrows | Indicate many rows — look for early filtering |
| Estimated ≠ Actual | Stale statistics — run UPDATE STATISTICS |
In the next tutorial, you will learn about SQL hints — how to override the optimizer's decisions when you know better.