Window NTILE
Introduction
The NTILE() function divides rows into a specified number of roughly equal groups (buckets or tiles) and assigns a group number to each row. It's perfect for creating quantiles, percentile groups, or distributing data evenly.
In this lesson, you will learn:
- How NTILE divides data into groups
- Creating quartiles, deciles, and percentiles
- How NTILE handles uneven distributions
- Practical applications for data segmentation
Understanding NTILE
NTILE divides an ordered set of rows into N groups and assigns each row a bucket number from 1 to N.
How It Works
- NTILE(4): Divides into 4 groups (quartiles)
- NTILE(10): Divides into 10 groups (deciles)
- NTILE(100): Divides into 100 groups (percentiles)
Example: 12 Rows with NTILE(4)
| Row | Value | NTILE(4) |
|---|---|---|
| 1 | 10 | 1 |
| 2 | 20 | 1 |
| 3 | 30 | 1 |
| 4 | 40 | 2 |
| 5 | 50 | 2 |
| 6 | 60 | 2 |
| 7 | 70 | 3 |
| 8 | 80 | 3 |
| 9 | 90 | 3 |
| 10 | 100 | 4 |
| 11 | 110 | 4 |
| 12 | 120 | 4 |
With 12 rows and 4 tiles, each tile gets exactly 3 rows.
Visualization
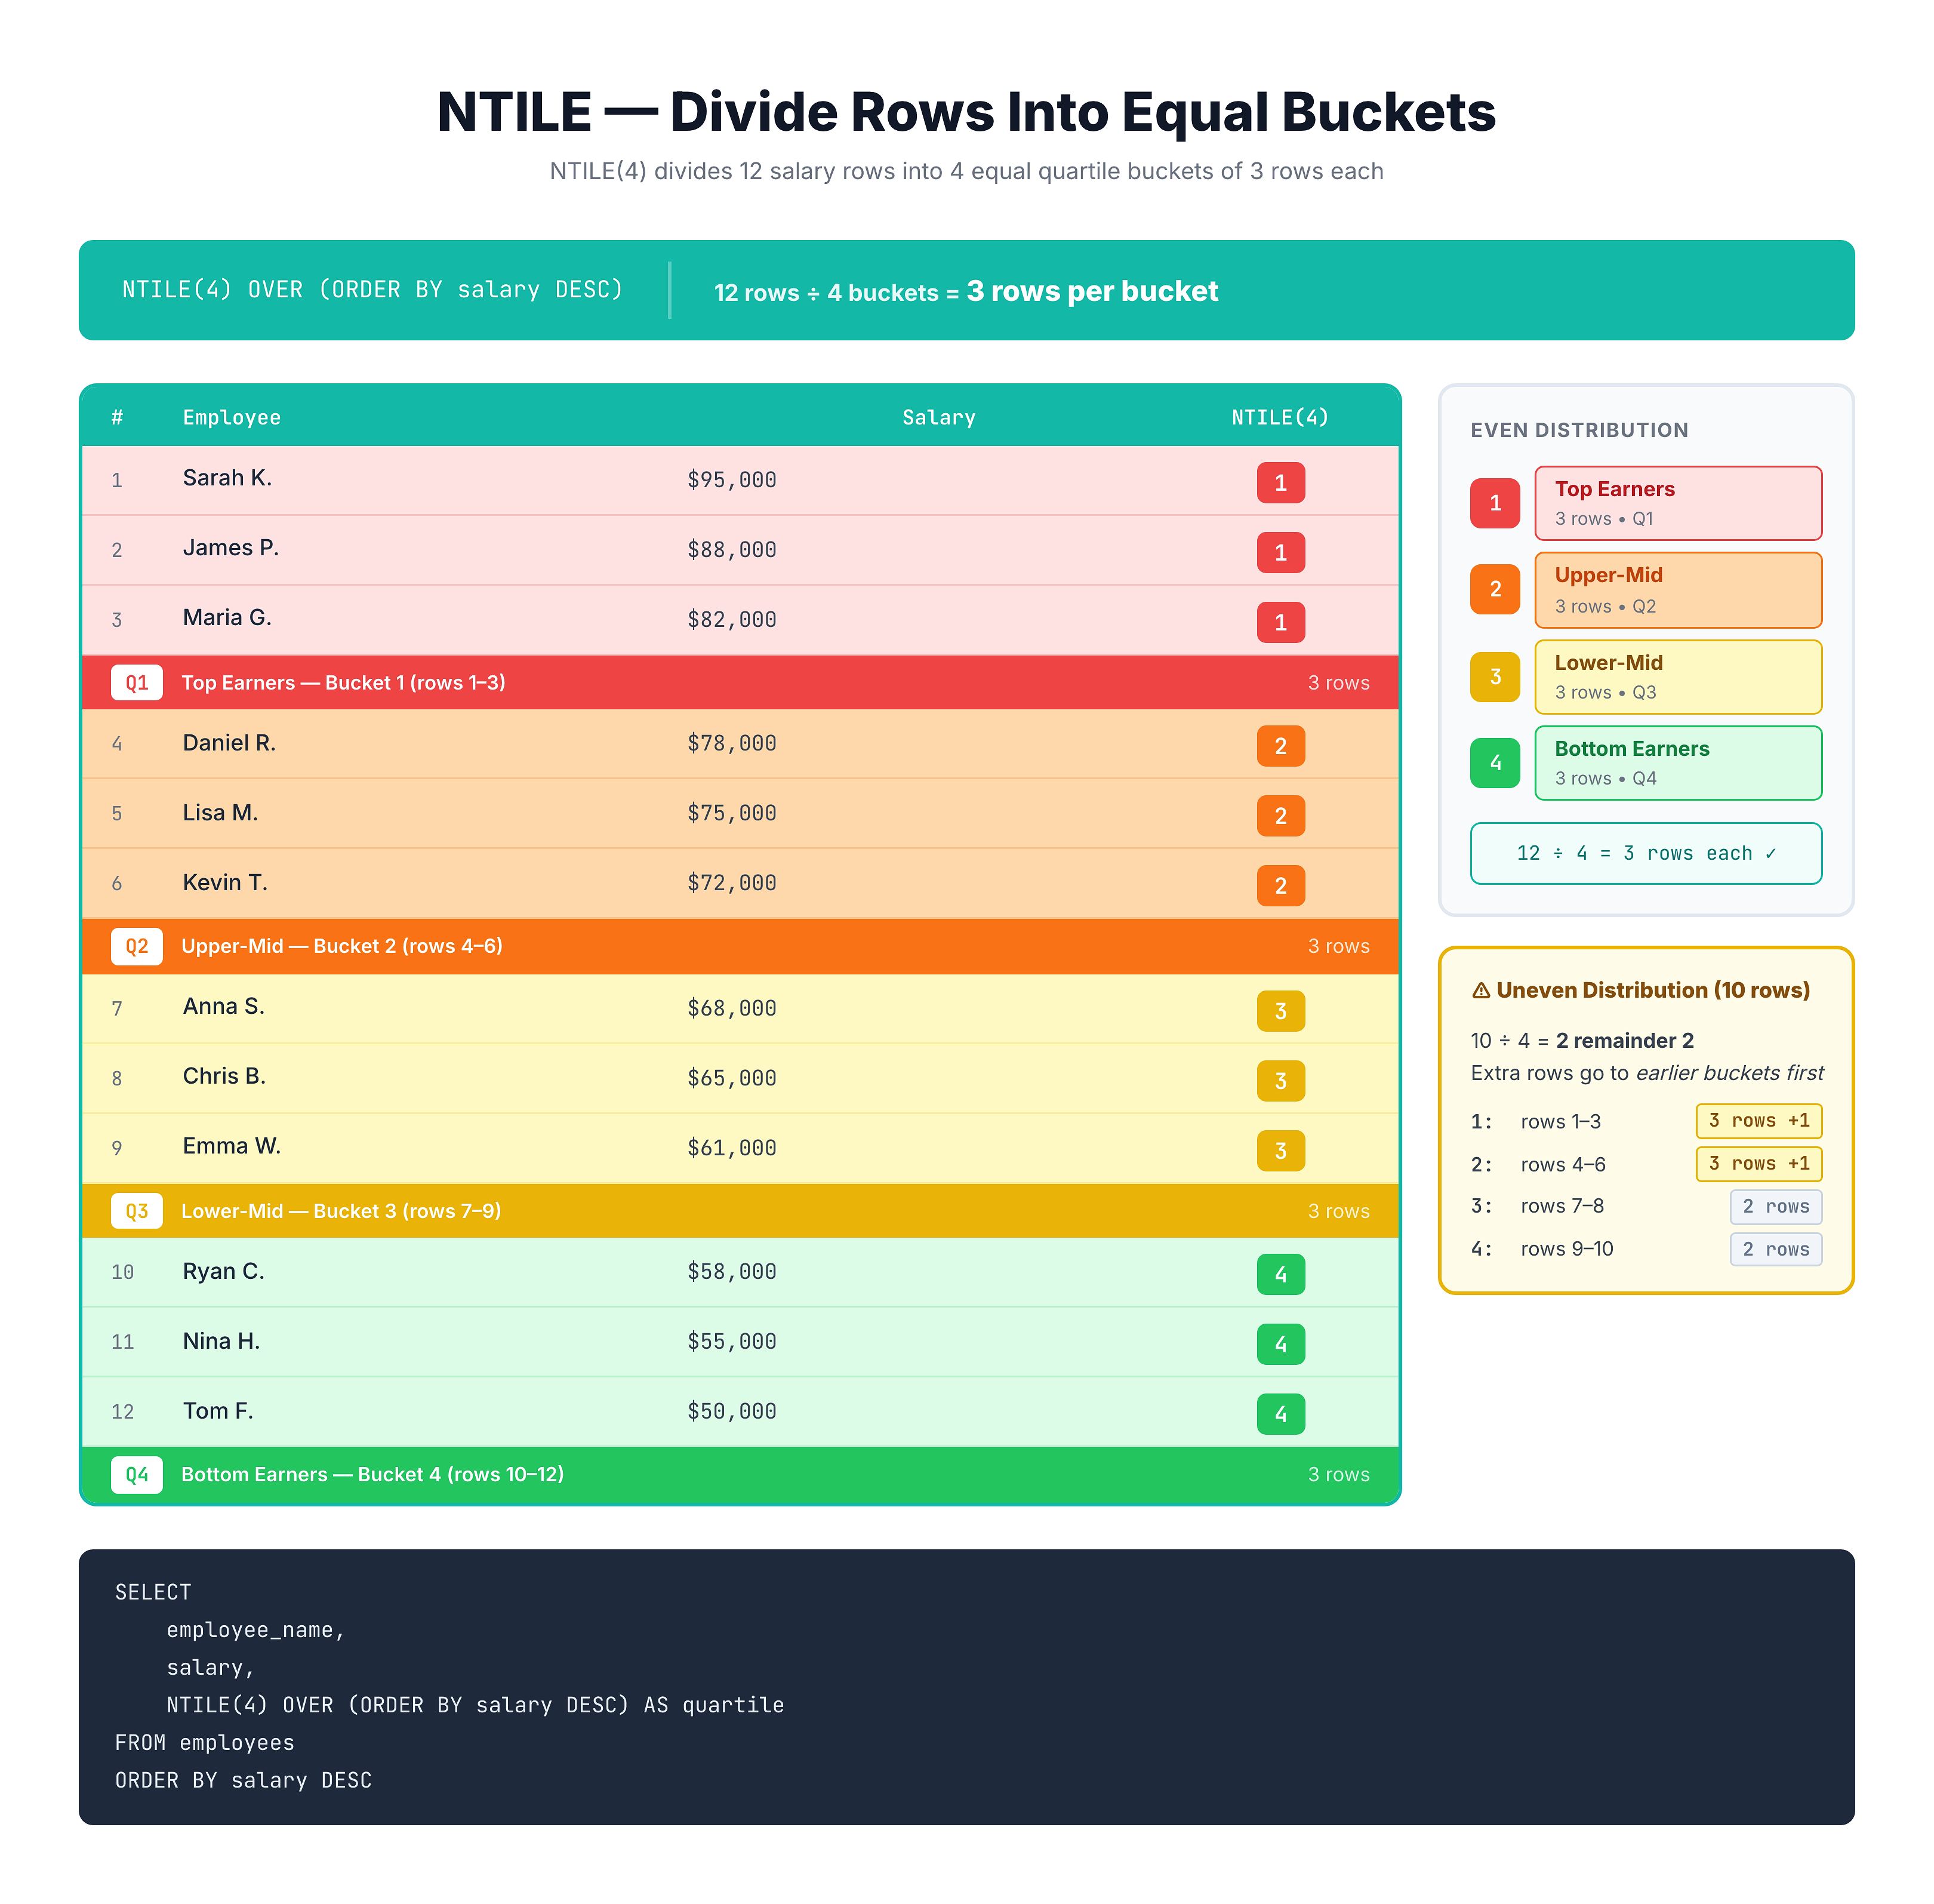
NTILE -- Distributing Rows Into Equal Buckets
Basic Syntax
The NTILE function follows this pattern:
NTILE(num_buckets) OVER (
    [PARTITION BY column(s)]
    ORDER BY column(s) [ASC|DESC]
)
Key Points
- Argument Required: Must specify the number of buckets (positive integer)
- ORDER BY Required: Must specify how rows are ordered before grouping
- Returns Integer: Values from 1 to num_buckets
- Roughly Equal: Groups are as equal as possible
Creating Quartiles
The most common use of NTILE is creating quartiles (4 groups):
Price Quartiles
-- Divide items into price quartiles
SELECT
    order_id,
    price,
    NTILE(4) OVER (ORDER BY price) AS price_quartile
FROM olist_order_items_dataset
LIMIT 25;
Labeling Quartiles
-- Add quartile labels
SELECT
    order_id,
    price,
    NTILE(4) OVER (ORDER BY price) AS quartile,
    CASE NTILE(4) OVER (ORDER BY price)
        WHEN 1 THEN 'Q1 (Lowest)'
        WHEN 2 THEN 'Q2'
        WHEN 3 THEN 'Q3'
        WHEN 4 THEN 'Q4 (Highest)'
    END AS quartile_label
FROM olist_order_items_dataset
LIMIT 25;
Creating Deciles and Percentiles
Deciles (10 Groups)
-- Divide into deciles (10 groups)
SELECT
    order_id,
    price,
    NTILE(10) OVER (ORDER BY price) AS price_decile
FROM olist_order_items_dataset
LIMIT 25;
Percentiles (100 Groups)
-- Divide into percentiles (100 groups)
SELECT
    order_id,
    price,
    NTILE(100) OVER (ORDER BY price) AS price_percentile
FROM olist_order_items_dataset
LIMIT 25;
The percentile value directly tells you which percentile (1-100) each item falls into.
Handling Uneven Distribution
When rows don't divide evenly, NTILE distributes extra rows to earlier buckets.
Example: 10 Rows with NTILE(4)
- 10 ÷ 4 = 2 remainder 2
- First 2 buckets get 3 rows each
- Last 2 buckets get 2 rows each
| Row | NTILE(4) |
|---|---|
| 1-3 | 1 (3 rows) |
| 4-6 | 2 (3 rows) |
| 7-8 | 3 (2 rows) |
| 9-10 | 4 (2 rows) |
See Distribution in Action
-- See how NTILE distributes rows
SELECT
    quartile,
    COUNT(*) AS rows_in_quartile,
    MIN(price) AS min_price,
    MAX(price) AS max_price
FROM (
    SELECT
        price,
        NTILE(4) OVER (ORDER BY price) AS quartile
    FROM olist_order_items_dataset
) with_quartiles
GROUP BY quartile
ORDER BY quartile;
NTILE with PARTITION BY
Create tiles within each group:
Quartiles within Each Seller
-- Price quartiles within each seller
SELECT
    seller_id,
    price,
    NTILE(4) OVER (
        PARTITION BY seller_id
        ORDER BY price
    ) AS seller_price_quartile
FROM olist_order_items_dataset
LIMIT 25;
Each seller's items are divided into 4 price groups independently.
Customer Segments within States
-- Divide customers into 3 groups per state
SELECT
    customer_state,
    customer_id,
    NTILE(3) OVER (
        PARTITION BY customer_state
        ORDER BY customer_id
    ) AS state_group
FROM olist_customers_dataset
LIMIT 25;
Practical Use Cases
Use Case 1: Customer Spending Tiers
-- Segment customers by spending into 5 tiers
SELECT
    customer_id,
    total_spent,
    spending_tier,
    CASE spending_tier
        WHEN 1 THEN 'Bronze'
        WHEN 2 THEN 'Silver'
        WHEN 3 THEN 'Gold'
        WHEN 4 THEN 'Platinum'
        WHEN 5 THEN 'Diamond'
    END AS tier_name
FROM (
    SELECT
        o.customer_id,
        ROUND(SUM(i.price), 2) AS total_spent,
        NTILE(5) OVER (ORDER BY SUM(i.price)) AS spending_tier
    FROM olist_orders_dataset o
    INNER JOIN olist_order_items_dataset i ON o.order_id = i.order_id
    GROUP BY o.customer_id
) customer_spending
LIMIT 20;
Use Case 2: Seller Performance Deciles
-- Rank sellers into performance deciles
SELECT
    seller_id,
    total_items,
    performance_decile
FROM (
    SELECT
        seller_id,
        COUNT(*) AS total_items,
        NTILE(10) OVER (ORDER BY COUNT(*)) AS performance_decile
    FROM olist_order_items_dataset
    GROUP BY seller_id
) seller_performance
LIMIT 20;
Use Case 3: Distribute Work Evenly
-- Distribute orders across 5 teams
SELECT
    order_id,
    order_purchase_timestamp,
    NTILE(5) OVER (ORDER BY order_id) AS team_assignment
FROM olist_orders_dataset
LIMIT 25;
This evenly distributes orders to 5 teams for processing.
NTILE vs Other Ranking Functions
Understanding when to use NTILE vs other functions:
| Function | Output | Use Case |
|---|---|---|
| NTILE(4) | 1, 2, 3, or 4 | Fixed number of equal groups |
| PERCENT_RANK | 0.0 to 1.0 | Continuous percentile |
| CUME_DIST | 0+ to 1.0 | Cumulative percentage |
| ROW_NUMBER | 1 to N | Unique sequential number |
-- Compare NTILE with percentage-based functions
SELECT
    price,
    NTILE(4) OVER (ORDER BY price) AS quartile,
    ROUND(PERCENT_RANK() OVER (ORDER BY price), 3) AS pct_rank,
    ROUND(CUME_DIST() OVER (ORDER BY price), 3) AS cume_dist
FROM olist_order_items_dataset
LIMIT 25;
Practice
Practice using NTILE with these exercises.
Exercise 1: Create Quartiles
Divide payment values into quartiles:
-- Payment quartiles
SELECT
    order_id,
    payment_value,
    NTILE(4) OVER (ORDER BY payment_value) AS payment_quartile
FROM olist_order_payments_dataset
LIMIT 20;
Exercise 2: Analyze Tile Distribution
See how tiles are distributed:
-- Analyze quartile distribution
SELECT
    quartile,
    COUNT(*) AS count,
    ROUND(MIN(price), 2) AS min_price,
    ROUND(MAX(price), 2) AS max_price,
    ROUND(AVG(price), 2) AS avg_price
FROM (
    SELECT
        price,
        NTILE(4) OVER (ORDER BY price) AS quartile
    FROM olist_order_items_dataset
) with_quartiles
GROUP BY quartile
ORDER BY quartile;
Exercise 3: Partitioned Tiles
Create deciles within each payment type:
-- Deciles within each payment type
SELECT
    payment_type,
    payment_value,
    NTILE(10) OVER (
        PARTITION BY payment_type
        ORDER BY payment_value
    ) AS value_decile
FROM olist_order_payments_dataset
LIMIT 25;
Key Takeaways
Here's what you've learned about NTILE:
- Purpose: Divides rows into N roughly equal groups
- Syntax:
NTILE(n)where n is the number of buckets - Output: Integer from 1 to n
- Uneven Distribution: Extra rows go to earlier buckets
- Use Cases: Quartiles, deciles, percentiles, work distribution
Common NTILE Values
| NTILE(n) | Name | Use Case |
|---|---|---|
| NTILE(2) | Halves | Above/below median |
| NTILE(4) | Quartiles | Statistical analysis |
| NTILE(5) | Quintiles | Star ratings, tiers |
| NTILE(10) | Deciles | Top 10% analysis |
| NTILE(100) | Percentiles | Fine-grained ranking |