Availability & the Nines
Introduction
"We're five nines." "Our SLA is 99.9%." You'll hear numbers like these in every design review, every vendor pitch, every incident post-mortem — and they sound reassuring in a way that quietly hides what they actually mean. So let's make one of them concrete before we do anything else.
99.9% available sounds like "basically always up." It is 8 hours and 45 minutes of downtime every year — about 44 minutes every month. If those 44 minutes land at 2 a.m. on a Tuesday, nobody notices. If they land on your checkout page during a flash sale, "three nines" is very cold comfort.
This is the first of the non-functional requirements — the qualities a system is judged on beyond "does it compute the right answer." Availability is where we start because it's the one everyone quotes and almost everyone misreads. By the end of this lesson you'll be able to do three things most people can't:
- Translate a percentage into real downtime — and feel why each extra "nine" is a big deal.
- Compose availability across a system — predict what happens to the whole when you chain services together or add redundancy (the answers are genuinely counterintuitive).
- Speak the language — SLI, SLO, SLA, error budget — that turns all of this into a business decision instead of a bragging number.
Two warnings up front, because they're the difference between quoting availability and understanding it: adding parts to a system usually makes it less available, not more — and the secret to high availability is often not failing less, but recovering faster. Let's see why.
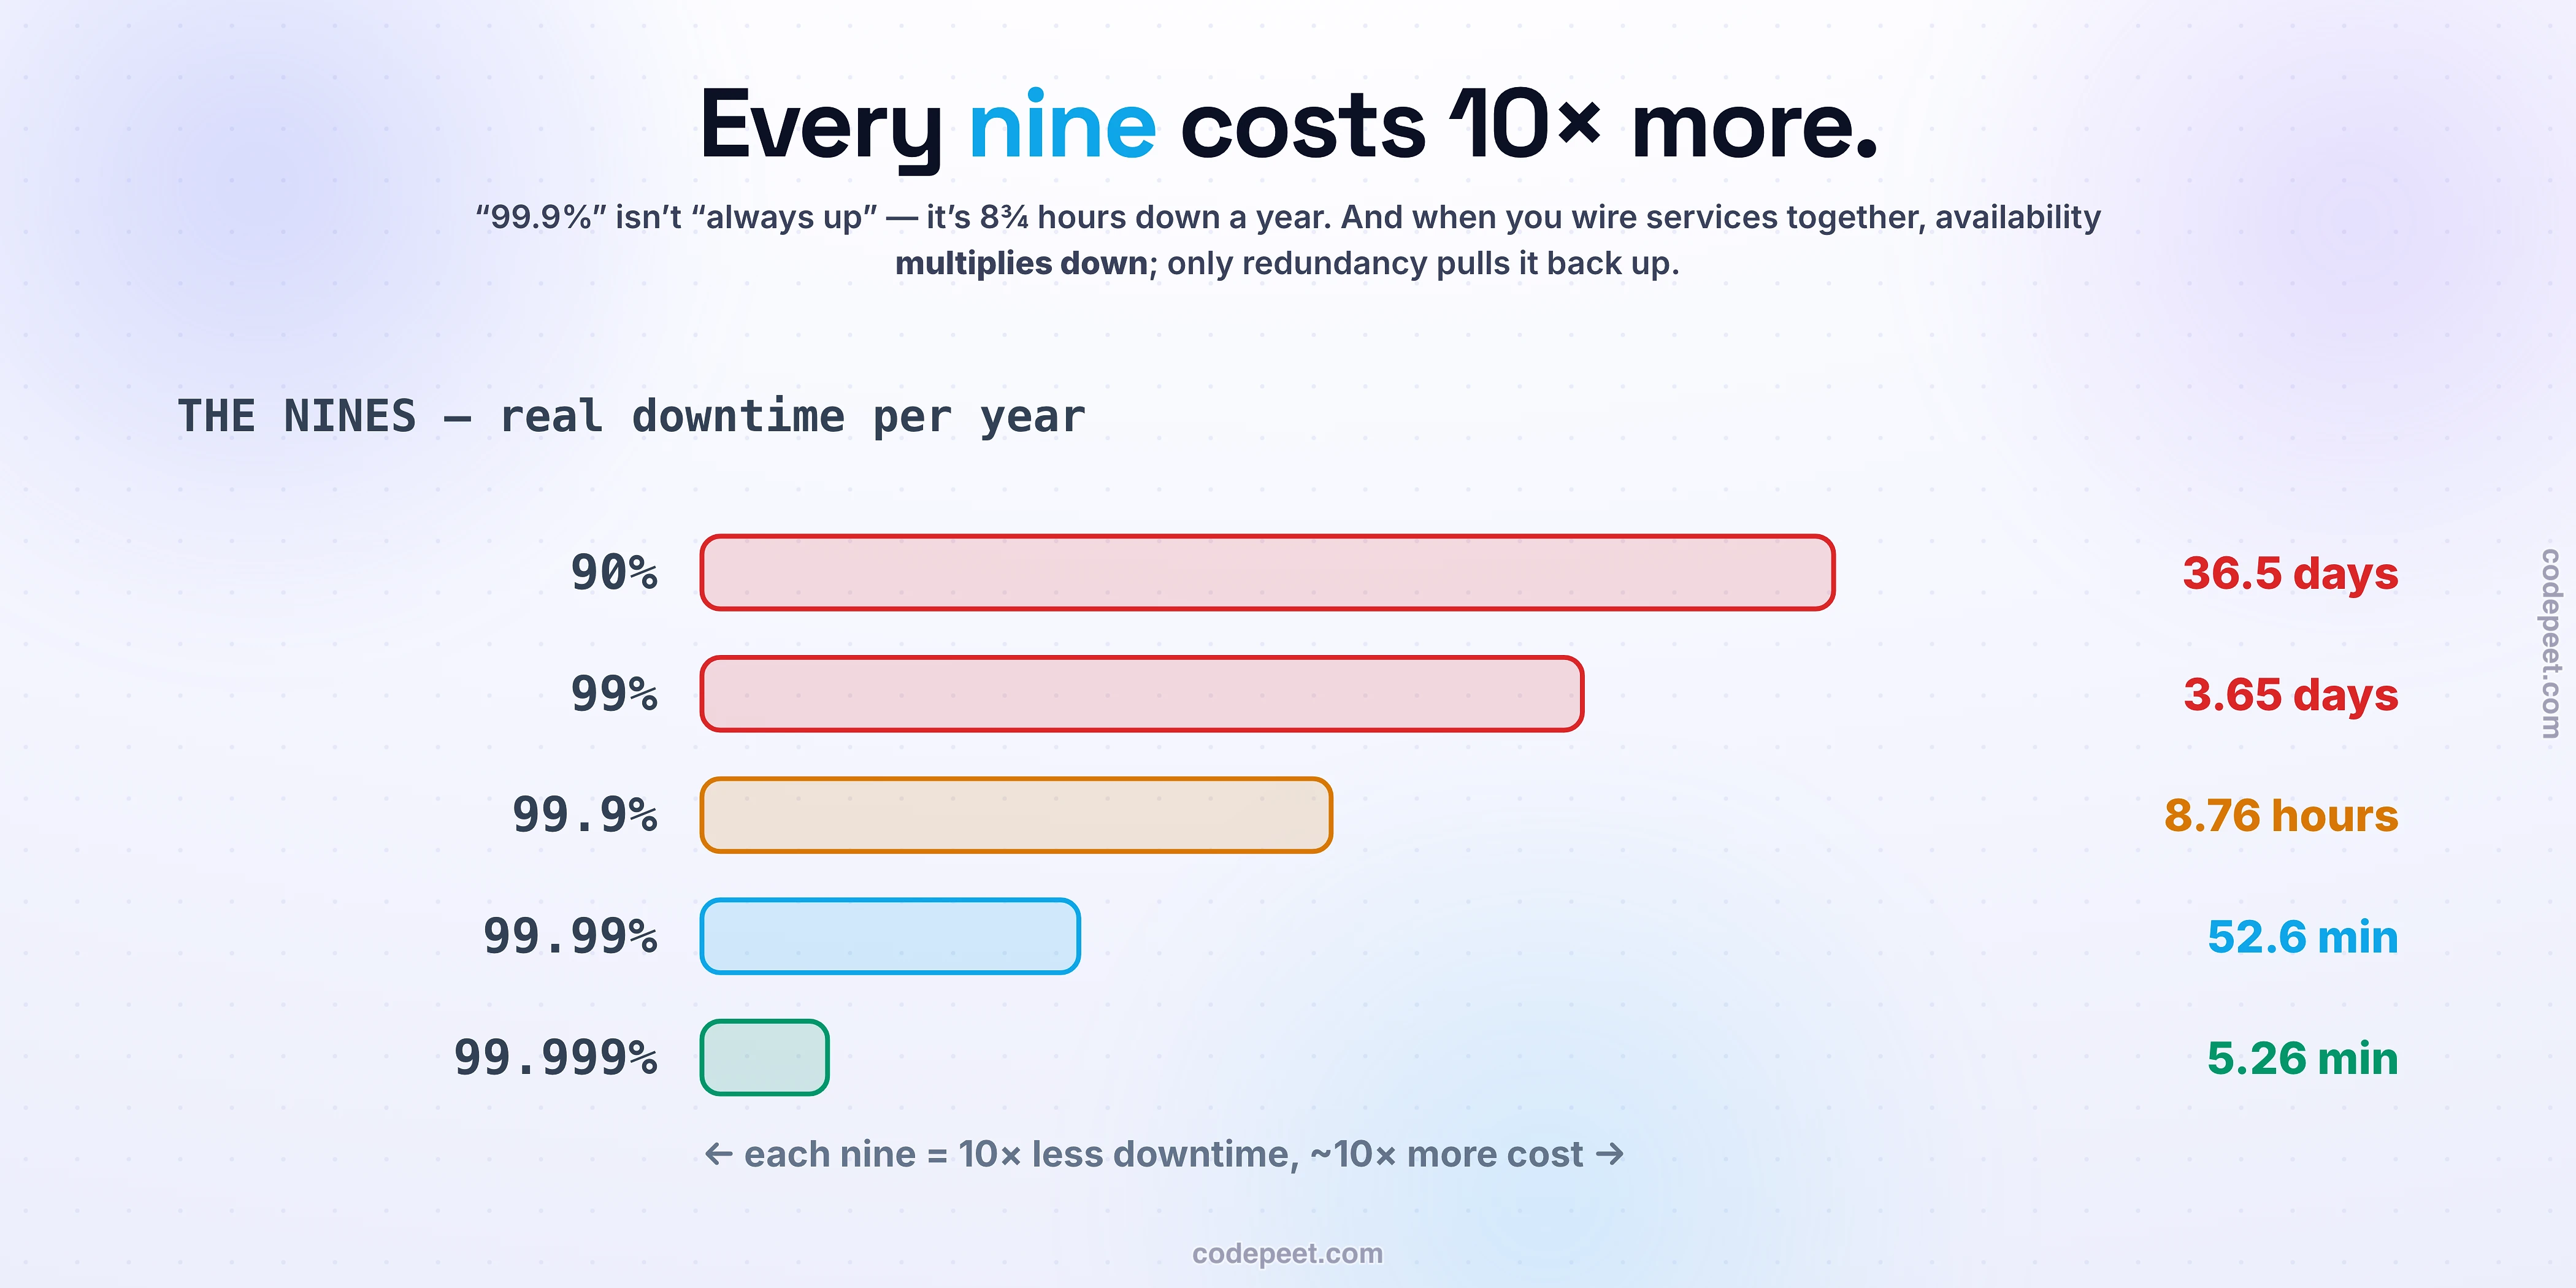
The Nines: What the Percentage Really Costs
The "nines" are just a way of translating a smug-sounding percentage into the thing you actually care about: how long you're down. Here's the table worth memorizing:
| Availability | Downtime per year | Downtime per month |
|---|---|---|
| 90% (one nine) | 36.5 days | ~73 hours |
| 99% (two nines) | 3.65 days | ~7.3 hours |
| 99.9% (three nines) | 8.76 hours | ~44 minutes |
| 99.99% (four nines) | 52.6 minutes | ~4.4 minutes |
| 99.999% (five nines) | 5.26 minutes | ~26 seconds |
Two things jump out. First, the top of the table is brutal — 90% is over a month of downtime a year. "One nine" is not a real target for anything. Second, look at the step between rows: every extra nine cuts the allowed downtime by a factor of ten. Going from three nines to four isn't a little better — it's 8.76 hours down to 52 minutes, a 10× improvement. And it costs roughly 10× more to achieve, every single time.
That last point is the whole economics of availability. Each nine is exponentially harder: more redundancy, more testing, more on-call, more failover machinery. Five nines — 26 seconds of downtime a month — is the realm of telecoms and core cloud primitives, and it is wildly expensive. Most good consumer web services live at three to four nines and are right to. The number isn't a trophy; it's a price tag, and we'll come back to how to choose it.
But a single number on a single box is the easy part. The interesting — and genuinely surprising — thing happens when you start wiring boxes together.
Two Levers: Fail Rarely, and Recover Fast
Before we compose systems, one formula reframes everything. Availability isn't a mystical property — it's a ratio of uptime to total time, and it comes from two things:
Availability = MTBF / (MTBF + MTTR)
MTBF is mean time between failures — how rarely the thing breaks. MTTR is mean time to recover — how fast you get it back. And here's the insight most people miss: these two levers move availability equally. You can buy a nine by failing half as often, or you can buy the same nine by recovering twice as fast.
Recovery is usually the cheaper lever — and often the only realistic one. Watch what MTTR alone does:
- A system that fails once a year but takes 2 hours to recover sits below three nines. Cut that recovery to 30 minutes — same failure rate — and you're at ~99.994%, nearly four nines.
- A system that fails every single week — that sounds terrible — but recovers in 5 minutes each time still hits ~99.95%.
Sit with that second one. Failing weekly and still beating three-and-a-half nines, purely because it heals fast. This flips the naive goal on its head: the path to high availability usually isn't "never fail" — it's "fail, notice instantly, and recover before anyone cares." Chasing a system that never breaks is a fool's errand; chasing one that heals in seconds is engineering. (That second art — how to fail without falling over — is the entire next lesson.)
Wiring the Chain: Why Adding Parts Makes It Worse
Now the counterintuitive heart of the lesson. Real requests don't hit one box — they pass through a chain: a load balancer, then a service, then a database, maybe a cache and an auth service too. Every one of those has to be working for the request to succeed. That's a series dependency, and series dependencies multiply.
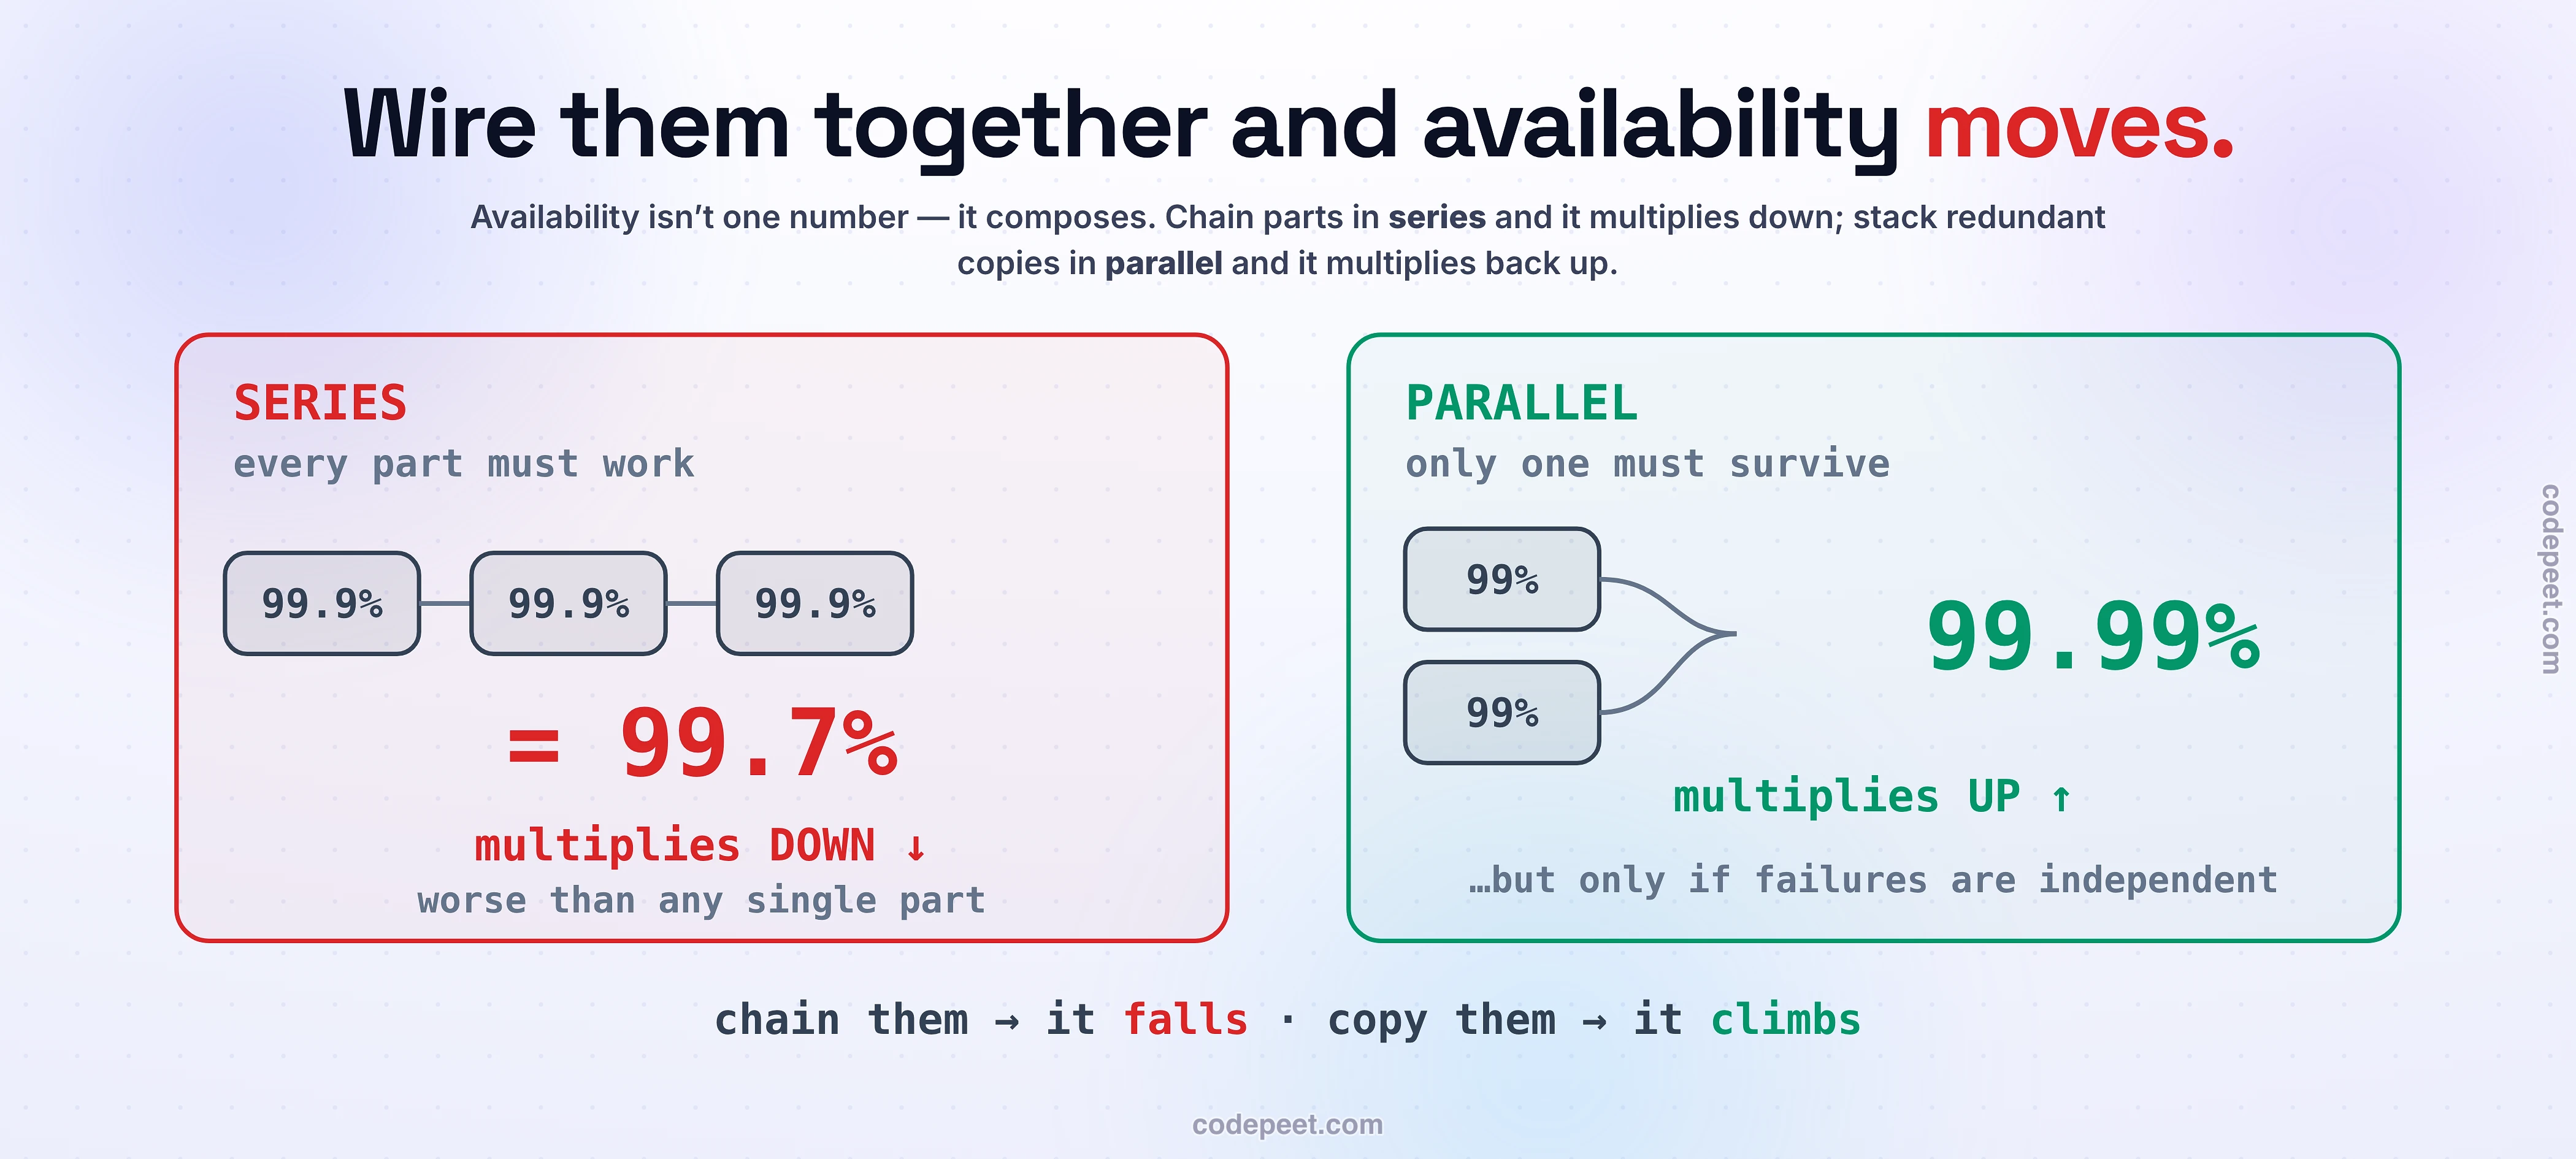
If a request needs A and B and C, then availability = A × B × C.
Multiplication of numbers below 1 only goes one direction: down. Take three services that are each a respectable 99.9%:
0.999 × 0.999 × 0.999 = 0.997 → 99.7%
Three parts that are each "three nines" combine into a system that's worse than any one of them — 99.7%, which is about 26 hours of downtime a year instead of 8.76. And it only gets worse as you add more: ten 99.9% services in a row give 99%, a full 3.65 days down a year.
This is the fact that breaks people's intuition: every dependency you add to the critical path lowers your availability. More microservices, more third-party APIs, more hops — each is another link that can break the chain. The old strand of Christmas lights is the perfect picture: wired in series, one dead bulb and the whole strand goes dark. It doesn't matter how good the other bulbs are.
So how does anything achieve high availability if adding parts only hurts? You fight multiplication with... multiplication — of a different kind.
Redundancy: How Parallel Copies Multiply You Back Up
The cure for a fragile chain is redundancy: run more than one copy of a component so that you only need one of them to survive. That's a parallel arrangement, and parallel flips the math in your favor — instead of multiplying availabilities, you multiply the unavailabilities (the chance they all fail at once):
With N copies, availability = 1 − (1 − a)ᴺ
Because unavailability is a small number, multiplying it by itself makes it tiny. Two servers that are each only 99% available, placed in parallel:
1 − (0.01 × 0.01) = 1 − 0.0001 = 99.99%
Two "two-nines" boxes became a four-nines stage — a 100× drop in downtime — just by running a second copy. Two 99.9% copies in parallel reach 99.9999% (six nines). One survivor is all you need, and the odds of both being down at the same moment are the product of two already-small numbers. The highway is the picture here: close one lane and traffic still flows down the others.
Put the two ideas together and you have the shape of every highly available system: a series chain of parallel stages. Requests flow through a sequence of steps (series, dragging you down), but each critical step is a little cluster of redundant copies (parallel, lifting it back up). The engineering job becomes clear and almost mechanical: find the weakest link in the chain and add redundancy there, because the whole system is capped by its least-available stage.
This composition — series drags down, parallel lifts up, weakest stage rules — is exactly the thing to build with your own hands rather than take on faith.
See It: Compose Your Own Availability
Below is a live availability calculator, but the good kind — you build the system and watch the number move. Start with a simple request path: Gateway → Service → Database. Set each stage's availability, and read the system availability it composes to, along with the real downtime per year and a stream of requests flowing through (watch roughly one in a thousand fail at 99.9%).
Now play with the two forces you just learned:
- Add a dependency to the chain and watch the system number drop — proof that every part in series multiplies you down.
- Add a replica to the weakest stage and watch it climb — parallel redundancy multiplying the unavailability away. Notice you get the most improvement by fixing the worst stage, not the best one.
- Then flip a redundant stage to "same AZ (correlated)" and watch its hard-won redundancy quietly collapse — because two copies that share a fate aren't really two copies at all.
Try to hit four nines. You'll discover you can't brute-force it by making one part great; you have to manage the whole chain.
The Catch: Redundancy Only Helps If Failures Are Independent
That parallel formula — 1 − (1 − a)ᴺ — has a hidden assumption baked into it, and it's the one that sinks real systems: it assumes the copies fail independently. That the chance of both going down at once is genuinely the product of two separate, unrelated probabilities.
In the real world, that assumption fails more often than it holds. Failures love to be correlated — to come from a single shared cause that takes out all your "redundant" copies at the same instant:
- Two servers in the same rack — one power supply or top-of-rack switch dies, both go with it.
- Two instances in the same data center — one cooling or utility failure, both gone.
- A shared dependency — both copies talk to the same DNS, the same config service, the same database; that dependency hiccups and your redundancy evaporates.
- One bad deploy pushed to the whole fleet, or an operator command run everywhere — identical copies fail in identical ways at the identical moment.
When failures are correlated, two "redundant" servers aren't 1 − (0.01)² = 99.99% available. They're closer to a single server that you paid twice for. Redundancy without independence is theater.
This is the entire reason cloud providers invented Availability Zones. An AWS AZ is a physically separate data center — its own power, its own cooling, its own network, kept up to ~100 km from the others — engineered specifically so that a fire, flood, or power failure in one cannot take down another. When you deploy across multiple AZs, you're not just buying more copies; you're buying independence — the thing that makes the parallel math actually true. Spreading further, across whole regions, buys even more. The lesson: don't count replicas, count independent replicas.
You’re Only as Available as Your Dependencies
Here's a humbling corollary of the series math, and one that catches teams by surprise: you cannot be more available than the things you depend on.
If your beautifully engineered service makes a synchronous call to some other service on every request — a payment provider, an auth service, a database — then that dependency is a link in your series chain. If it's 99.9% available, your request path is capped at 99.9%, no matter how bulletproof your own code is. You inherited its downtime. Teams building a rock-solid service are often baffled by their availability numbers until they realize a flaky third-party API on the critical path was quietly setting their ceiling.
The only way to beat the cap is to break the hard dependency — to make the other service's failure not your failure:
- Cache its responses, so you can serve a slightly stale answer when it's down.
- Make the call asynchronous — drop the work on a queue and process it later, so a momentary outage delays rather than fails the request.
- Have a fallback — a sensible default, a degraded mode, a "try again shortly" that keeps the core flow alive.
Each of these turns a hard dependency (its failure = your failure) into a soft one (its failure = a graceful degradation). That's the same lesson from L2, seen from the availability side: the shared store and database your stateless fleet leans on are dependencies in your chain — protect them, or cap yourself at their weakest moment.
The Language of Promises: SLI, SLO, SLA, Error Budget
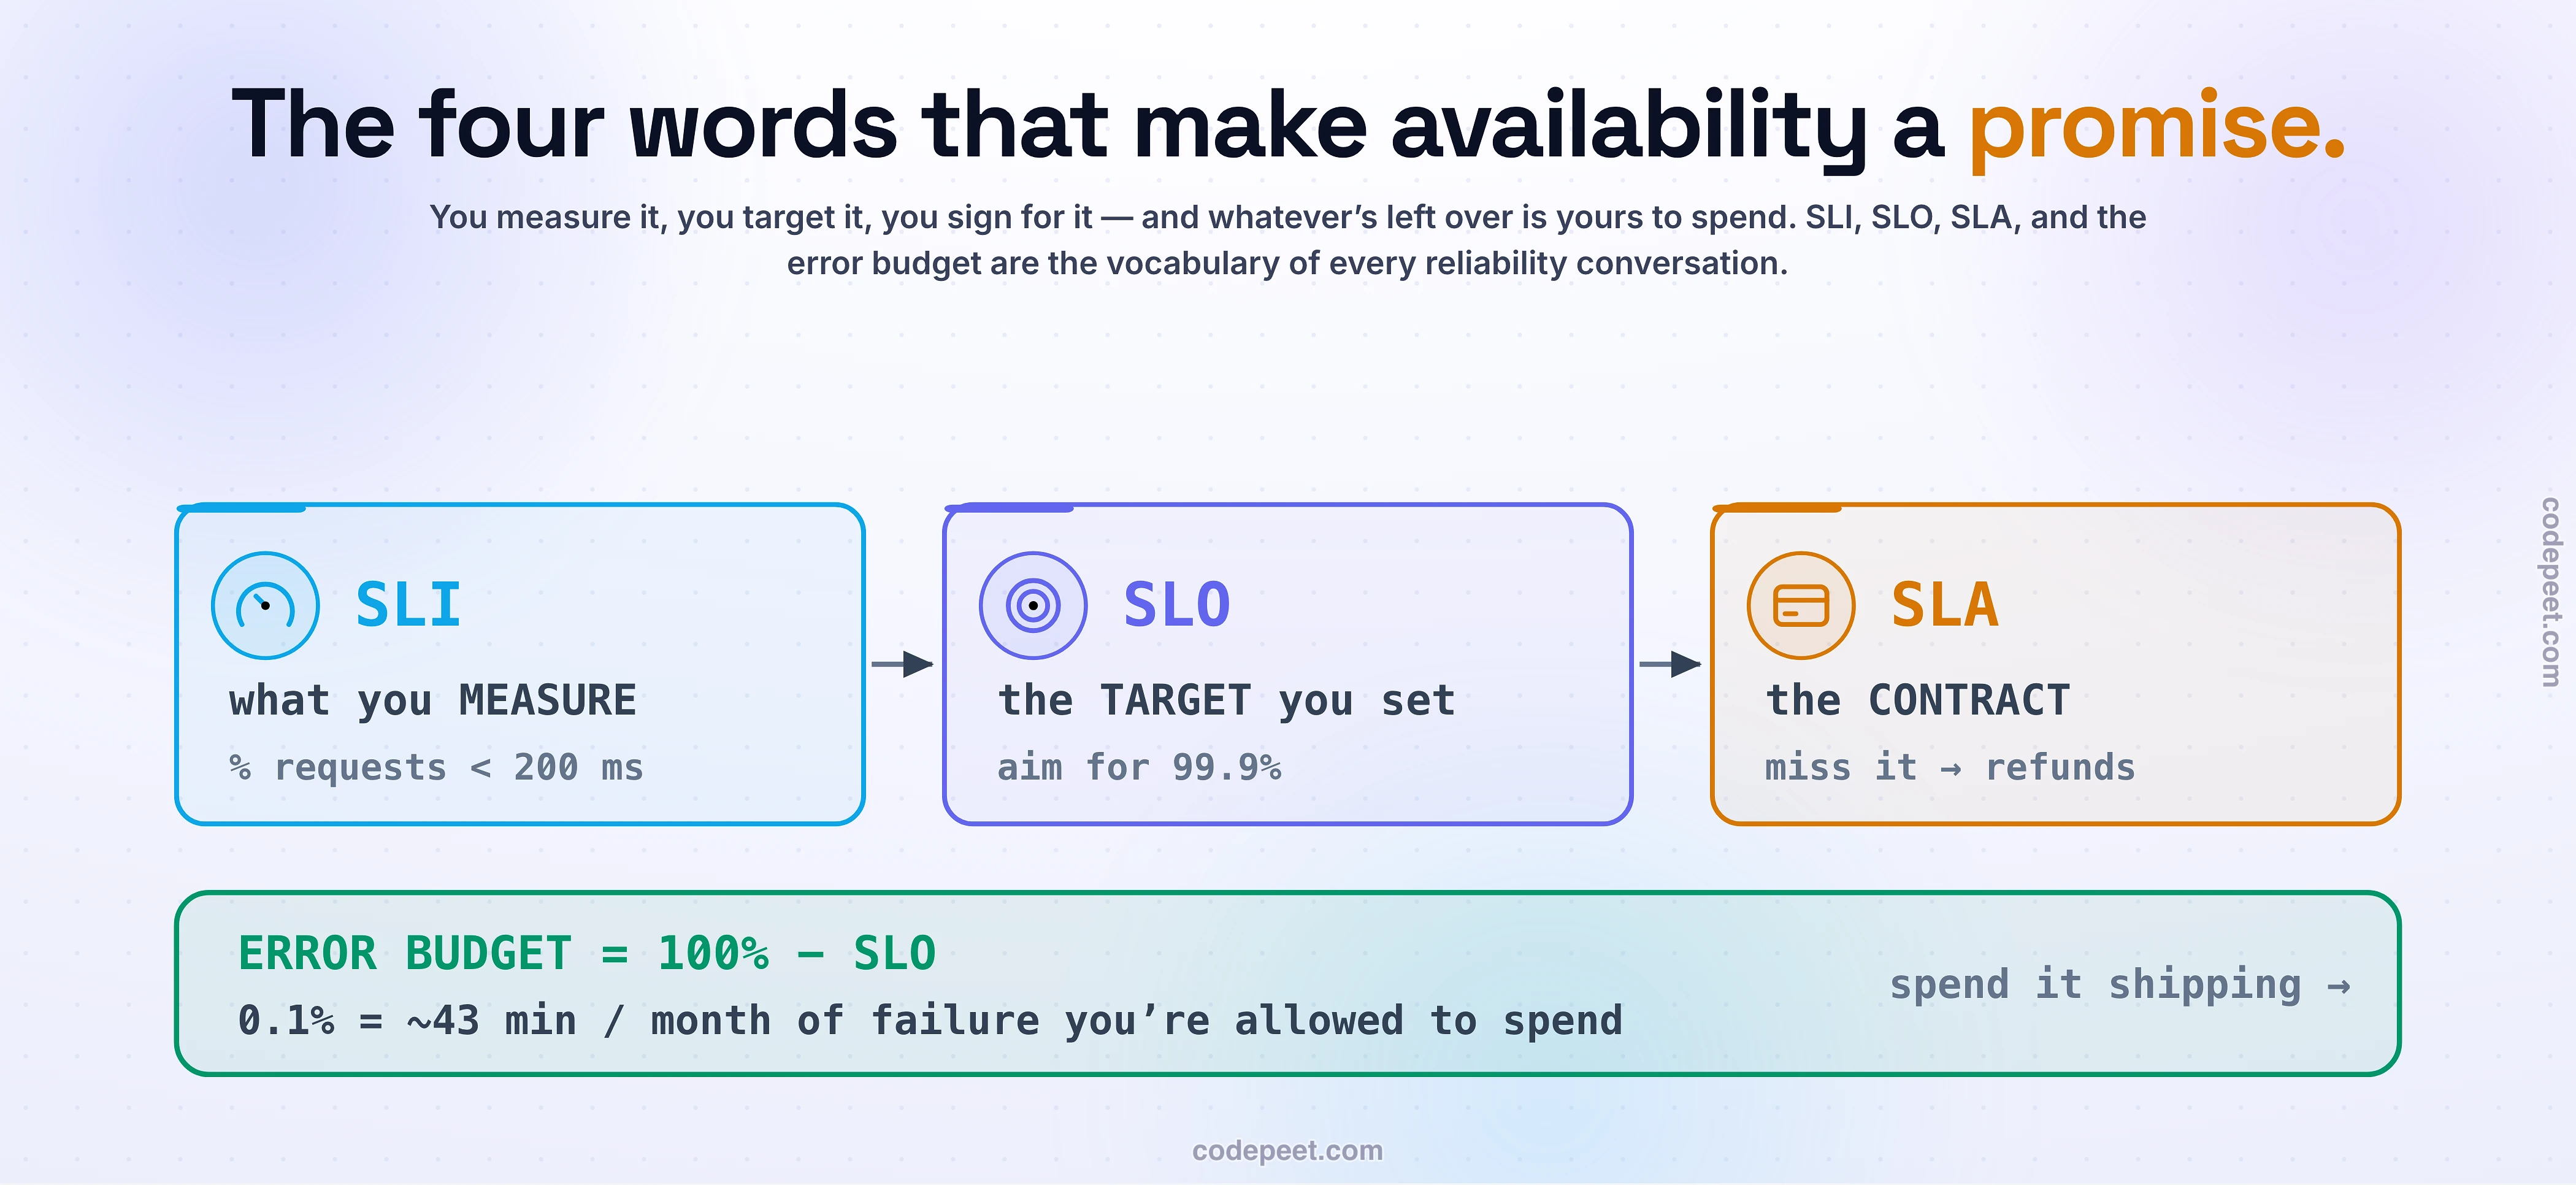
Availability only becomes useful when you can promise it and manage it — and that needs precise words. Four of them, and people constantly blur them:
- SLI — Service Level Indicator. The measurement. A real number from the user's point of view: "99.95% of requests succeeded last month," "the 99th-percentile latency was 240 ms." It's what you actually observe.
- SLO — Service Level Objective. The target you set on an SLI. "99.9% of requests should succeed." This is your internal engineering goal — the line you're trying to stay above.
- SLA — Service Level Agreement. The contract with your customers, with real consequences — usually money back — if you miss it. Because breaking it costs you, you always set your SLO stricter than your SLA: aim for 99.95% internally so you have a safety margin before the 99.9% you legally promised.
The fourth idea is the one that changes how teams behave:
Error budget = 100% − SLO.
If your SLO is 99.9%, you are allowed to be down 0.1% of the time. That 0.1% isn't a failure to hide — it's a budget to spend. Over a month of 3 million requests, a 99.9% SLO buys you a budget of 3,000 failed requests. As long as budget remains, engineering can ship risky features, run experiments, do migrations — spend the budget on velocity. When the budget runs out, the policy flips: freeze risky changes and pour effort into stability until you're back in the black. It turns the endless "reliability versus shipping" argument into a single shared number that decides it. That's the quiet genius of the error budget — it makes reliability a resource, not a religion.
The Trade-off
So should you just chase as many nines as possible? Absolutely not — and knowing why is what separates an engineer from a marketer.
Every nine you add costs roughly ten times more than the last: more redundant hardware across more independent zones, more automated failover, more testing, more people on call. And redundancy isn't free in a second way — each redundant path is more complexity (failover logic, split-brain avoidance, keeping copies in sync), and complexity is itself a source of outages. Past a certain point, adding a nine causes more failures than it prevents.
| More availability buys you… | …but it costs |
|---|---|
| less downtime (10× per nine) | ~10× money & effort per nine |
| redundancy across zones/regions | operational complexity (a failure source itself) |
| customer trust, SLA headroom | slower shipping if you starve the error budget |
So the target is a business decision, priced in dollars, not a number to maximize. The right question is never "how many nines can we get?" — it's "what does a minute of downtime actually cost us, and where does the curve cross?" Five nines for a personal blog is malpractice; three nines for a cardiac monitor is negligence. A checkout page that loses $50,000 a minute justifies spending enormously on availability; an internal analytics dashboard that nobody reads at 3 a.m. does not.
Match the availability to what the failure genuinely costs — and put the money where the weakest, most-expensive-to-lose link actually is.
Mental-Model Corrections
"99.9% basically means always up." It means 8.76 hours a year — ~44 minutes a month — of downtime. Tiny as a percentage, huge if it's your checkout.
"More servers and services make a system more reliable." More components in series multiply you down (0.999³ = 99.7%). Adding a dependency lowers availability; only parallel redundancy raises it.
"Redundancy always multiplies availability." Only if the copies fail independently. Same rack, same zone, same deploy, same DNS → correlated failure → the copies die together and the math lies.
"Availability is about never failing." It's MTBF and MTTR. A system that fails weekly but recovers in 5 minutes beats one that fails yearly but limps for hours. Heal fast.
"SLA, SLO, and the uptime number are the same thing." SLI is the measurement, SLO is the internal target, SLA is the external contract with penalties (looser than the SLO). Error budget = 1 − SLO.
"Aim for five nines." Each nine costs ~10× more. Most services want three or four. Buy the availability the business actually needs — no more.
"Our published uptime number tells the whole story." Only if you define what "down" means — partial degradation? one region? planned maintenance excluded? Otherwise it's marketing.
Try It Yourself: Do the Availability Math on Something Real
Ten minutes turns the nines from trivia into an instinct. Predict first: a service that calls three different 99.9% APIs on every request — what's the best availability it can possibly have?
- Compose a real chain. Sketch the request path of an app you know: client → CDN → load balancer → app server → database → maybe a third-party payment or auth API. Give each a plausible availability (99.9% is a fair default; a flaky third party might be 99%). Multiply them. Is the result higher or lower than you guessed? Where's the weakest link?
- Buy a nine two ways. Take your worst stage. First, imagine halving how often it fails (better MTBF). Then instead imagine halving how long it takes to recover (better MTTR). Notice they help about equally — and ask which one your team could actually deliver next quarter.
- Read a real SLA. Pull up the SLA page of a cloud service you use (AWS, GCP, Stripe, Cloudflare — they're all public). Find the exact percentage, what they count as "downtime," and what you actually get if they miss it (hint: usually a service credit, not your business back). Notice how carefully the definition is written.
Once you instinctively multiply the chain, hunt for the weakest link, and ask "independent or correlated?" — you're reading availability like an architect instead of a brochure.
Recap & What’s Next
The first NFR, in seven lines:
- Availability is the fraction of time your system actually serves users — and the "nines" translate it to real downtime (99.9% = 8.76 h/year, ~44 min/month). Each nine is ~10× less downtime and ~10× more cost.
- Availability = MTBF / (MTBF + MTTR) — so recovering fast buys as much as failing rarely, and usually costs less.
- Dependencies in series multiply down (three 99.9% services = 99.7%) — every part you add to the critical path lowers the whole.
- Redundancy in parallel multiplies up (two 99% copies = 99.99%) — but only if failures are independent (same rack/zone/deploy = correlated = the math lies; that's why Availability Zones exist).
- You're capped by your hard dependencies — beat the cap only by decoupling (cache, async, fallback).
- SLI (measure) → SLO (target) → SLA (contract), and the error budget (1 − SLO) is the failure allowance you spend on shipping.
- More nines is a priced business decision, not a trophy — match it to what downtime costs.
Notice what this whole lesson could only measure. It told you 99.9% is 44 minutes a month, that a chain multiplies down, that recovering fast is half the battle — but it never told you how to build a system that shrugs off a failed dependency instead of falling over with it. That's the difference between the scoreboard and the game. Next, we play the game: Reliability & Fault Tolerance — Failing Without Falling — retries, timeouts, circuit breakers, graceful degradation, and the art of turning a failure into a shrug.