EDA Recap: What It Is and Why Data Analysts Do It
Revisiting EDA
Now that you have completed a full EDA project — from database exploration through ranking analysis — let's step back and reflect on what EDA is, why it matters, and how it fits into the broader world of data analytics.
This lesson connects the practical skills you just learned to the bigger picture.
The Formal Definition of EDA
Exploratory Data Analysis (EDA) is an approach to analyzing datasets to summarize their main characteristics, often using statistical graphics and summary tables. The concept was pioneered by statistician John Tukey in the 1970s.
In modern data analytics, EDA is the process of:
- Understanding the structure of the data
- Identifying patterns, trends, and anomalies
- Testing assumptions about the data
- Generating hypotheses for further investigation
- Ensuring data quality before building reports or models
EDA is not about proving anything — it is about discovery. You are looking for what the data has to tell you, rather than trying to confirm a preconceived idea.
Why Data Analysts Perform EDA
Every professional data analyst performs EDA as part of their workflow. Here is why:
1. To Avoid Costly Mistakes
Building a dashboard on data you do not understand is dangerous. EDA catches problems early:
- Missing data that would create gaps in reports
- Incorrect joins that would produce wrong numbers
- Date range issues that would lead to unfair comparisons
2. To Build Trust in the Data
Stakeholders ask tough questions: "Are these numbers right?" After thorough EDA, you can confidently answer because you have verified the data from every angle.
3. To Discover Business Insights
Some of the most valuable insights come from EDA, not from formal analysis. During exploration, you might discover that:
- One country generates 80% of all revenue
- A specific product category has unusually low sales
- Customer acquisition has been declining for months
4. To Guide Further Analysis
EDA tells you what is worth investigating deeper. If you discover that sales are concentrated in 3 countries, you know to focus your advanced analysis on geographic patterns.
5. To Communicate Data Understanding
EDA findings — like key metrics summaries, dimension distributions, and rankings — are often shared with stakeholders as part of a data assessment or discovery phase.
EDA Techniques We Covered
Let's map the EDA techniques from this project to their analytical purposes:
| Technique | What We Did | Analytical Purpose |
|---|---|---|
| Database Exploration | Queried INFORMATION_SCHEMA | Understand structure and metadata |
| Dimensions Exploration | Used SELECT DISTINCT | Discover categorical values and data quality issues |
| Date Exploration | Used MIN(), MAX(), DATEDIFF() | Establish temporal boundaries |
| Measure Exploration | Used SUM(), COUNT(), AVG() | Calculate baseline business metrics |
| Magnitude Analysis | Used GROUP BY with aggregates | Understand metric distributions across categories |
| Ranking Analysis | Used TOP and RANK() | Identify top and bottom performers |
Each technique answers a different type of question, and together they give you a complete picture of the dataset.
EDA in the Real World
In professional settings, EDA typically happens at several points:
When Starting a New Project
The first thing an analyst does when assigned to a new dataset is EDA. Before building anything, you need to understand what you are working with.
When Data Sources Change
If a new data source is added or an existing one changes format, EDA helps you assess the impact and understand the new data.
When Numbers Look Wrong
If a report shows unexpected results, EDA helps you trace the issue back to its root cause — perhaps a join is wrong, a filter is missing, or the data itself has quality issues.
When Preparing for Stakeholder Questions
Before presenting analysis, experienced analysts run EDA to anticipate questions. "What is the date range?" "How many customers?" "Which countries?" These are questions stakeholders always ask.
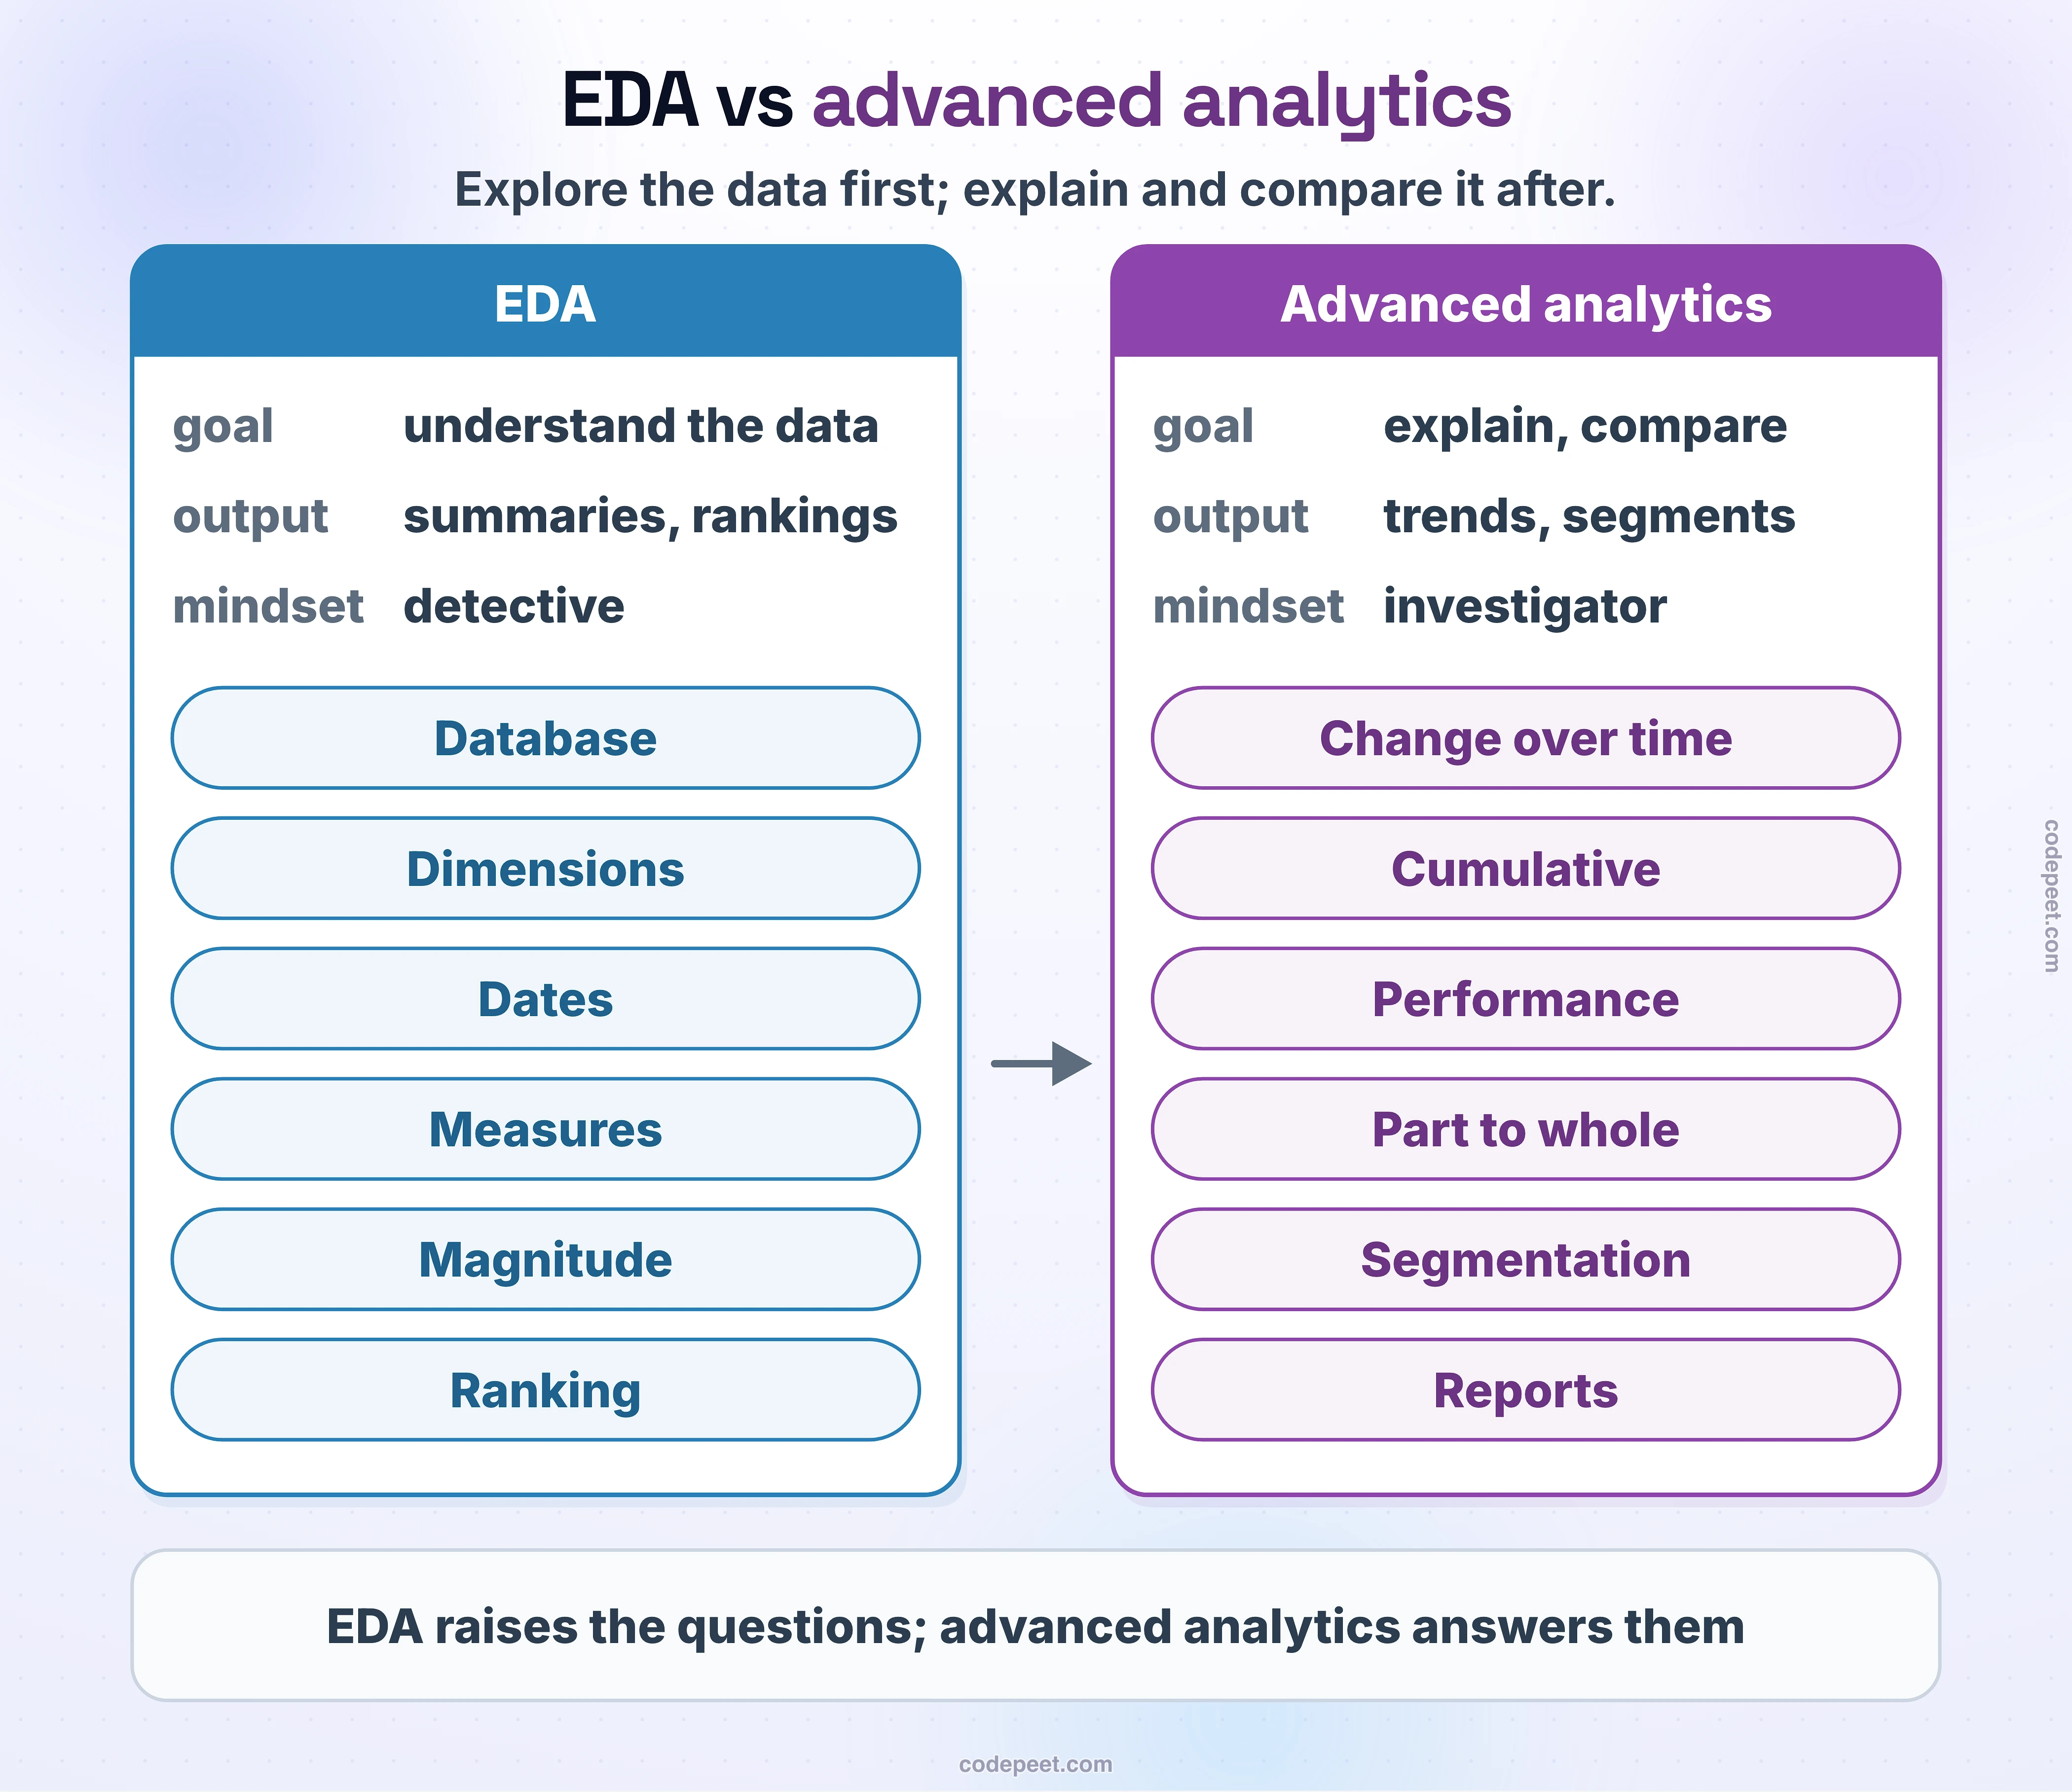
EDA vs Advanced Analytics
It is important to understand where EDA sits in the analytics spectrum:
| Aspect | Exploratory Data Analysis | Advanced Analytics |
|---|---|---|
| Goal | Understand and discover | Explain and compare |
| Approach | Open-ended exploration | Hypothesis-driven analysis |
| Complexity | Basic to intermediate SQL | Intermediate to advanced SQL |
| Output | Summaries, distributions, rankings | Trends, comparisons, segments, reports |
| When | Beginning of a project | After EDA is complete |
| Techniques | DISTINCT, GROUP BY, aggregates, TOP | Window functions, CTEs, CASE, complex JOINs |
EDA is the foundation. Advanced analytics builds on top of it. You cannot do advanced analytics well without first doing thorough EDA.
Key Takeaways from This Project
Here is what you should take away from this EDA project:
- Always start with structure — Know your tables, columns, and relationships before querying
- Explore dimensions first — Understand what categorical values exist
- Establish date boundaries — Know the valid time range before analyzing trends
- Calculate baseline metrics — Have reference numbers to compare everything against
- Use GROUP BY for distributions — See how metrics break down across categories
- Rank to prioritize — Identify what matters most (top performers) and what needs attention (bottom performers)
- Document everything — EDA findings are valuable artifacts for the project
These practices will serve you in every data analytics project, regardless of the tools or databases you use.
What Comes Next?
With EDA complete, you are ready for advanced data analytics — the next project in the course. Advanced analytics builds on your EDA foundation with techniques like:
- Change Over Time Analysis — Track how metrics evolve month over month
- Cumulative Analysis — Calculate running totals and growth curves
- Performance Analysis — Compare individual performance against benchmarks
- Part-to-Whole Analysis — Understand what percentage each category contributes
- Data Segmentation — Group customers and products into meaningful segments
All of these advanced techniques assume you have already done your EDA — that you understand the data structure, dimensions, date ranges, and key metrics. That is exactly what you have accomplished in this project.