Data Analytics Project Roadmap
Introduction
Every successful data analytics project follows a structured roadmap. Without a clear plan, you end up writing random queries with no coherent story. In this lesson, we lay out the step-by-step roadmap that guides our entire EDA project.
This roadmap applies not just to this project, but to any data analytics project you encounter in your career.
The Six Phases of a Data Analytics Project
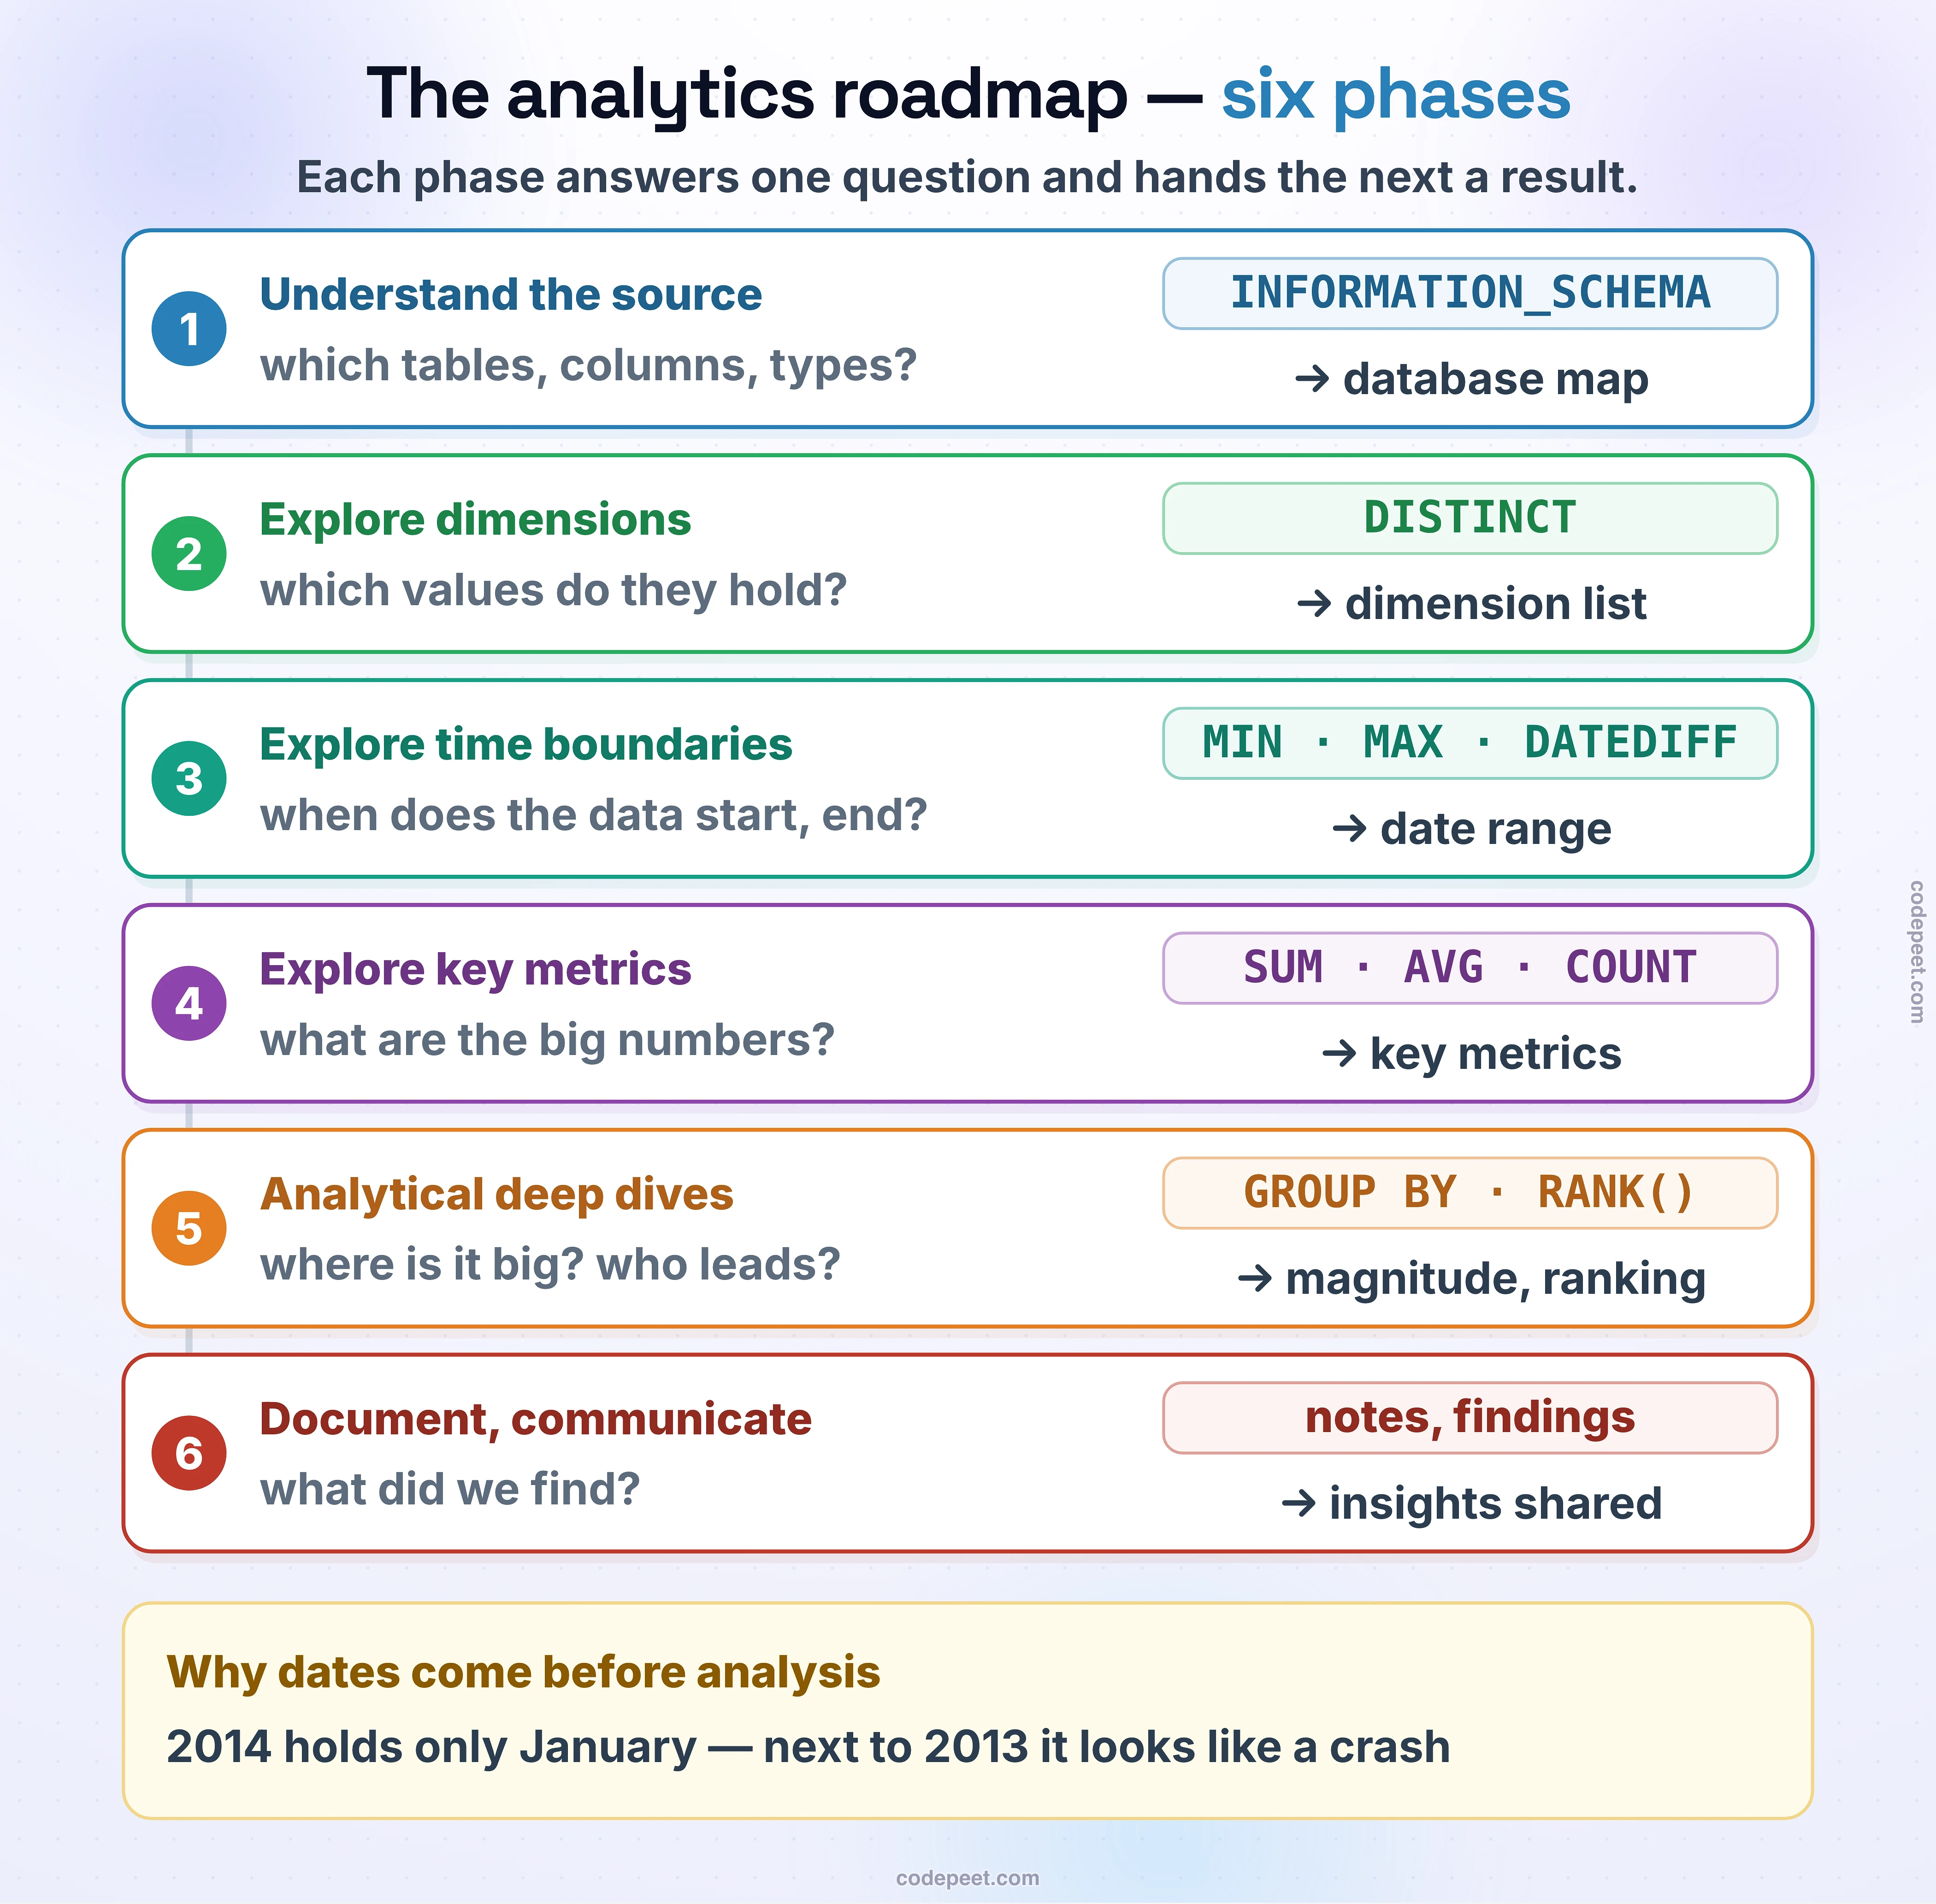
A data analytics project typically moves through six distinct phases:
Phase 1: Understand the Data Source
Before writing a single query, understand what data you have. This means:
- What tables exist in the database?
- What columns does each table contain?
- What are the data types?
- How do the tables relate to each other?
Phase 2: Explore Dimensions
Dimensions are the categorical columns in your data — things like country, gender, product category, and subcategory. Exploring dimensions tells you what is in the data.
Phase 3: Explore Time Boundaries
Understand the temporal range of your data. When does the data start? When does it end? How many months or years does it cover? This sets the context for any time-based analysis.
Phase 4: Explore Key Metrics
Metrics (also called measures) are the numerical values you can aggregate — total sales, average price, order count. Calculate the high-level numbers to get a sense of the business.
Phase 5: Perform Analytical Deep Dives
Once you understand the basics, dig deeper with specific analytical techniques:
- Magnitude Analysis — Group metrics by dimensions to see distributions
- Ranking Analysis — Identify top and bottom performers
Phase 6: Document and Communicate
EDA is only valuable if you communicate your findings. Document key insights, data quality issues, and interesting patterns.
Roadmap for This Project
Here is the specific roadmap we follow in this EDA project:
| Step | Topic | What You Learn |
|---|---|---|
| 1 | Database Exploration | Table structures, column metadata, schema layout |
| 2 | Dimensions Exploration | Unique countries, categories, subcategories, products |
| 3 | Date Exploration | Order date ranges, customer age ranges |
| 4 | Measure Exploration | Total sales, quantities, prices, orders, customers |
| 5 | Magnitude Analysis | Metrics grouped by country, gender, category |
| 6 | Ranking Analysis | Top/bottom products, customers by revenue and orders |
Each step builds on the previous one. By the end, you will have a thorough understanding of the dataset and be ready for advanced analytics.
Why This Order Matters
The order of this roadmap is intentional:
- Structure first — You cannot explore data you do not understand structurally
- Dimensions before measures — Knowing the categorical landscape helps you design meaningful aggregations
- Dates before analysis — Understanding the time range prevents misinterpretation (e.g., comparing partial months)
- Measures before deep dives — High-level numbers give you a baseline to compare deeper analysis against
- Analysis last — Magnitude and ranking analysis are meaningful only after you understand the data foundation
Skipping steps leads to errors. For example, if you run a magnitude analysis without first checking the date range, you might compare a full year of sales against a partial year and draw incorrect conclusions.
Summary
The data analytics project roadmap is your guide through every EDA project:
- Understand the data source (schema and structure)
- Explore dimensions (categorical columns)
- Explore date boundaries (temporal context)
- Explore key metrics (numerical summaries)
- Perform analytical deep dives (magnitude, ranking)
- Document and communicate findings
Follow this roadmap, and you will always produce thorough, reliable analysis.