Introduction to EDA
What is Exploratory Data Analysis?
Exploratory Data Analysis (EDA) is the process of examining and investigating a dataset to understand its structure, patterns, relationships, and anomalies before performing any formal analysis or building reports.
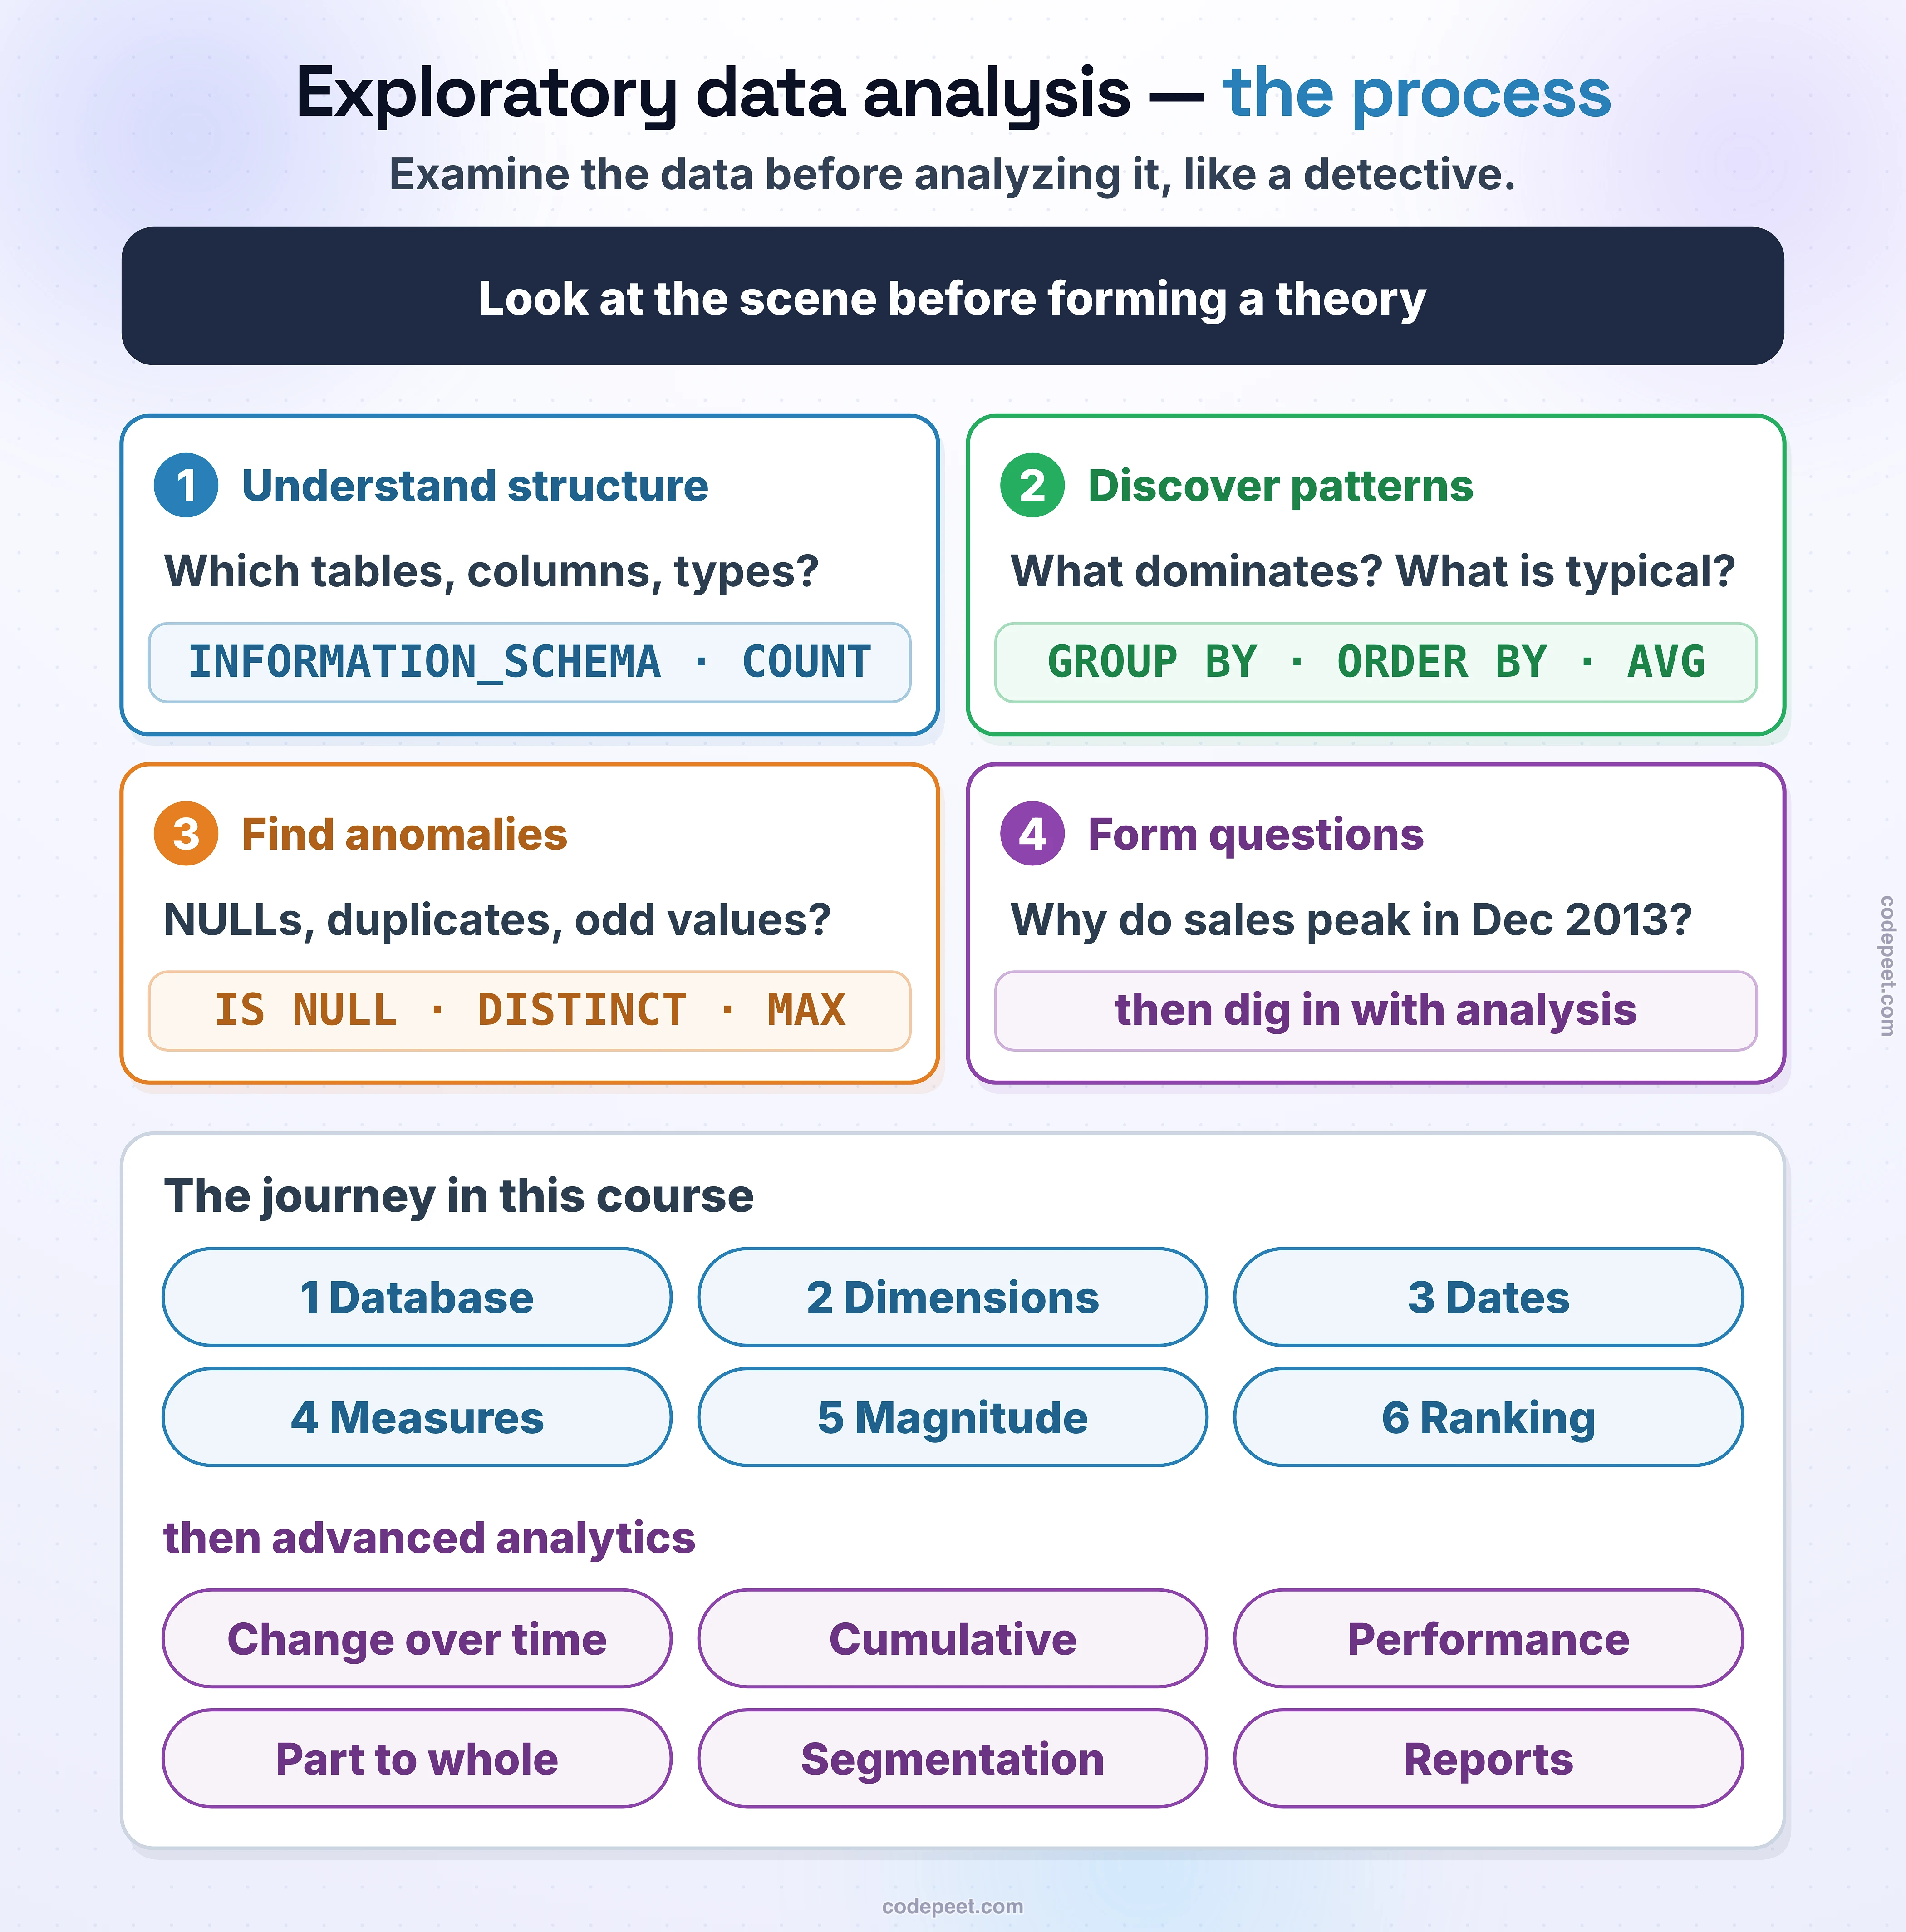
Think of EDA as the detective work that happens before you draw conclusions. Just like a detective examines a crime scene before forming a theory, a data analyst explores the data before building dashboards or making recommendations.
EDA answers fundamental questions:
- What does the data look like?
- How much data do we have?
- Are there any missing values or oddities?
- What are the key patterns and distributions?
- How do different variables relate to each other?
Why is EDA Important?
EDA is a critical first step in any data project for several reasons:
1. Understand the Data Before Making Decisions
Jumping into building reports or models without understanding the data leads to incorrect conclusions. EDA helps you catch issues early — things like unexpected NULL values, duplicates, or skewed distributions.
2. Validate Data Quality
Real-world data is rarely clean. EDA helps you identify:
- Missing or incomplete records
- Inconsistent formats (e.g., dates stored as strings)
- Outliers that could skew results
- Duplicate entries
3. Discover Patterns and Relationships
By exploring the data, you often discover insights you were not specifically looking for. For example, you might find that most customers come from a specific country, or that sales have a seasonal pattern.
4. Build a Foundation for Analysis
EDA provides the groundwork for everything that follows — from building KPIs to creating dashboards. The better you understand the data, the more meaningful your analysis will be.
EDA in the Context of SQL
SQL is one of the most powerful tools for performing EDA. Since the data already lives in a database, SQL lets you explore it directly without exporting to other tools.
Here are the key SQL techniques used in EDA:
| Technique | SQL Feature | Purpose |
|---|---|---|
| Schema Inspection | INFORMATION_SCHEMA views | Understand table structures and column types |
| Distinct Values | SELECT DISTINCT | Explore unique values in categorical columns |
| Aggregations | COUNT(), SUM(), AVG() | Calculate key metrics and summaries |
| Grouping | GROUP BY | Break down metrics by categories |
| Ordering | ORDER BY | Sort results to find top/bottom values |
| Date Analysis | MIN(), MAX(), DATEDIFF() | Understand time ranges and boundaries |
| Ranking | RANK(), ROW_NUMBER(), TOP | Identify top and bottom performers |
Our EDA Project Overview
In this project, we will perform a comprehensive EDA on a data warehouse built from sales, customer, and product data. The data has already been cleaned and organized into a star schema with three Gold layer tables:
- gold.dim_customers — Customer dimension (names, countries, gender, birthdate)
- gold.dim_products — Product dimension (names, categories, subcategories, cost)
- gold.fact_sales — Sales facts (orders, quantities, prices, dates)
Our EDA journey will cover:
- Database Exploration — What tables and columns exist?
- Dimensions Exploration — What unique values do our categorical columns hold?
- Date Exploration — What is the time range of our data?
- Measure Exploration — What are the key business metrics?
- Magnitude Analysis — How are metrics distributed across categories?
- Ranking Analysis — Who are the top and bottom performers?
The EDA Mindset
As you work through this project, adopt an exploratory mindset:
- Be curious — Ask questions about every result you see
- Be skeptical — Do not take numbers at face value; verify them
- Be systematic — Follow a structured approach (structure → dimensions → dates → measures → analysis)
- Document findings — Keep notes on interesting patterns or data quality issues
EDA is not about finding the "right answer." It is about understanding the data deeply enough to ask the right questions later.