Dimensions vs Measures
Introduction
Before we start exploring data, there is one fundamental concept you must understand: the difference between dimensions and measures. This distinction is at the heart of every data analysis, every dashboard, and every report you will ever build.
Getting this concept right makes everything else in analytics easier to understand.
What Are Dimensions?
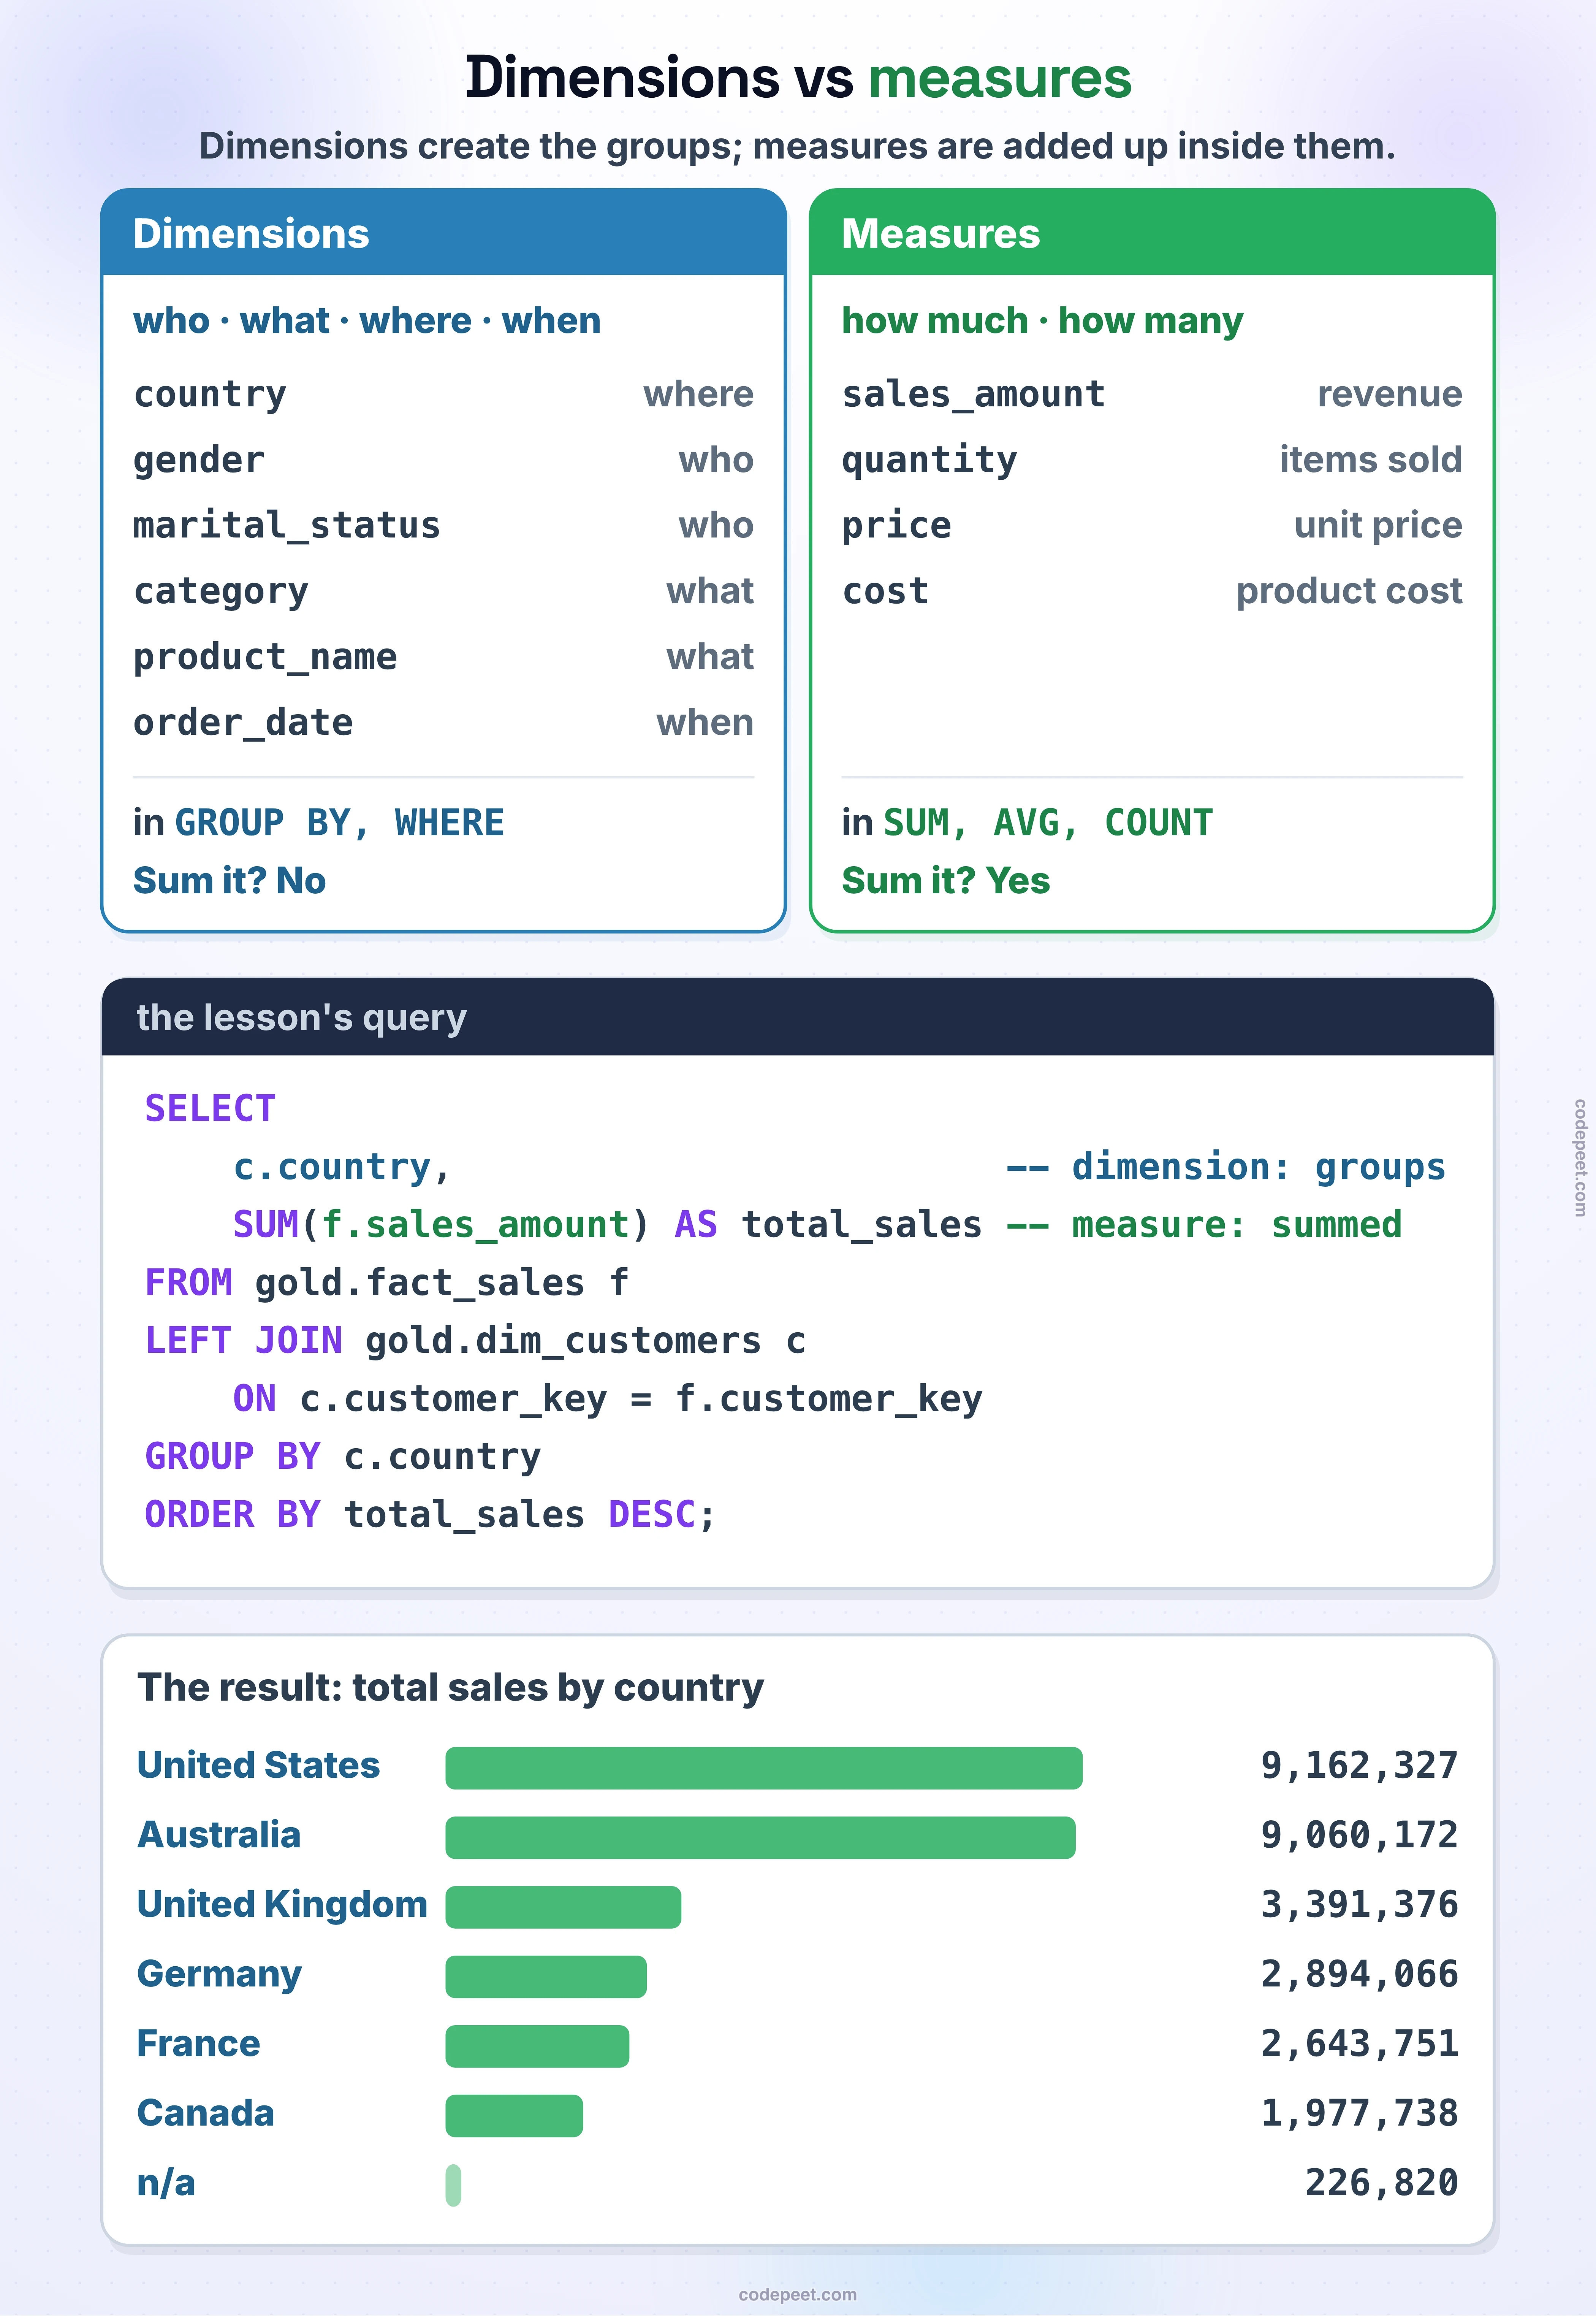
Dimensions are the descriptive, categorical columns in your data. They tell you the who, what, where, and when of your business events.
Dimensions are used to:
- Group data into categories
- Filter data to specific subsets
- Slice metrics from different angles
Examples from Our Database
| Table | Column | Dimension Values |
|---|---|---|
| dim_customers | country | Germany, France, Australia, ... |
| dim_customers | gender | Male, Female, n/a |
| dim_customers | marital_status | Single, Married |
| dim_products | category | Bikes, Components, Accessories, Clothing |
| dim_products | subcategory | Mountain Bikes, Road Bikes, Helmets, ... |
| dim_products | product_name | Mountain-100 Black- 42, AWC Logo Cap, ... |
Key Characteristics of Dimensions
- They are usually text (strings) or dates
- You cannot meaningfully sum or average them
- You use them in
GROUP BY,WHERE, andORDER BYclauses - They answer qualitative questions: "Which country?" "What product?"
What Are Measures?
Measures are the numerical, quantitative values in your data. They tell you how much, how many, or how often something happened.
Measures are used to:
- Aggregate data (sum, count, average)
- Calculate KPIs and business metrics
- Compare performance across groups
Examples from Our Database
| Table | Column | What It Measures |
|---|---|---|
| fact_sales | sales_amount | Revenue from a sale |
| fact_sales | quantity | Number of items sold |
| fact_sales | price | Unit selling price |
| dim_products | cost | Product cost |
Key Characteristics of Measures
- They are usually numbers (integers, decimals)
- You can meaningfully sum, average, count, and compare them
- You use them with aggregate functions:
SUM(),AVG(),COUNT(),MIN(),MAX() - They answer quantitative questions: "How much revenue?" "How many orders?"
Dimensions vs Measures: Side by Side
Here is a clear comparison:
| Aspect | Dimensions | Measures |
|---|---|---|
| Type | Categorical (text, dates) | Numerical |
| Purpose | Describe and categorize | Quantify and calculate |
| SQL Usage | GROUP BY, WHERE, ORDER BY | SUM(), AVG(), COUNT() |
| Question | Who? What? Where? When? | How much? How many? |
| Examples | Country, Category, Gender | Sales, Quantity, Price |
| Can you sum it? | No (summing country names is meaningless) | Yes (summing sales gives total revenue) |
How They Work Together
The real power comes from combining dimensions and measures. Dimensions are the lens through which you view measures.
For example:
-- Total sales (measure) broken down by country (dimension)
SELECT
    c.country,              -- dimension: groups the data
    SUM(f.sales_amount) AS total_sales  -- measure: aggregated value
FROM gold.fact_sales f
LEFT JOIN gold.dim_customers c
    ON c.customer_key = f.customer_key
GROUP BY c.country
ORDER BY total_sales DESC;
In this query:
- country is the dimension — it groups rows into categories
- sales_amount is the measure — it gets summed within each group
You can swap the dimension to see the same measure from a different angle:
-- Same measure (total sales), different dimension (product category)
SELECT
    p.category,              -- different dimension
    SUM(f.sales_amount) AS total_sales  -- same measure
FROM gold.fact_sales f
LEFT JOIN gold.dim_products p
    ON p.product_key = f.product_key
GROUP BY p.category
ORDER BY total_sales DESC;
Same measure, different dimension, completely different insight. This is the core pattern of data analytics:
Measure + Dimension = Insight
Edge Cases: When It Is Not Clear
Some columns can act as both depending on context:
- Dates are technically dimensions (they categorize events by time), but they can also be used to calculate measures (e.g.,
DATEDIFF()produces a number) - Price is a measure, but if you use it to create price ranges (e.g., "under 100-$500"), those ranges become dimensions
- Order number is a dimension (it identifies an order), but
COUNT(DISTINCT order_number)turns it into a count of orders — a new measure derived from a dimension
The rule of thumb: if you are grouping by it, it is acting as a dimension. If you are aggregating it, it is acting as a measure.
Summary
Understanding dimensions vs measures is the foundation of data analytics:
- Dimensions = descriptive, categorical columns used for grouping and filtering
- Measures = numerical columns used for aggregation and calculation
- Together = dimensions slice measures to produce insights
As we move through the EDA project, every query you write will combine dimensions and measures. Keep this distinction in mind — it will make every analysis clearer.