Introduction to the Project_analytics
Welcome to the Advanced Data Analytics Project
Welcome to the SQL Advanced Data Analytics Project — the next step in your SQL journey. In the previous project (Exploratory Data Analysis), you learned how to explore and understand a dataset. Now, we move beyond exploration and into actionable analytics.
In this project, you will learn how to write SQL queries that answer real business questions using advanced analytical techniques. By the end, you will have built two comprehensive business reports and documented your work professionally.
What is Advanced Data Analytics?
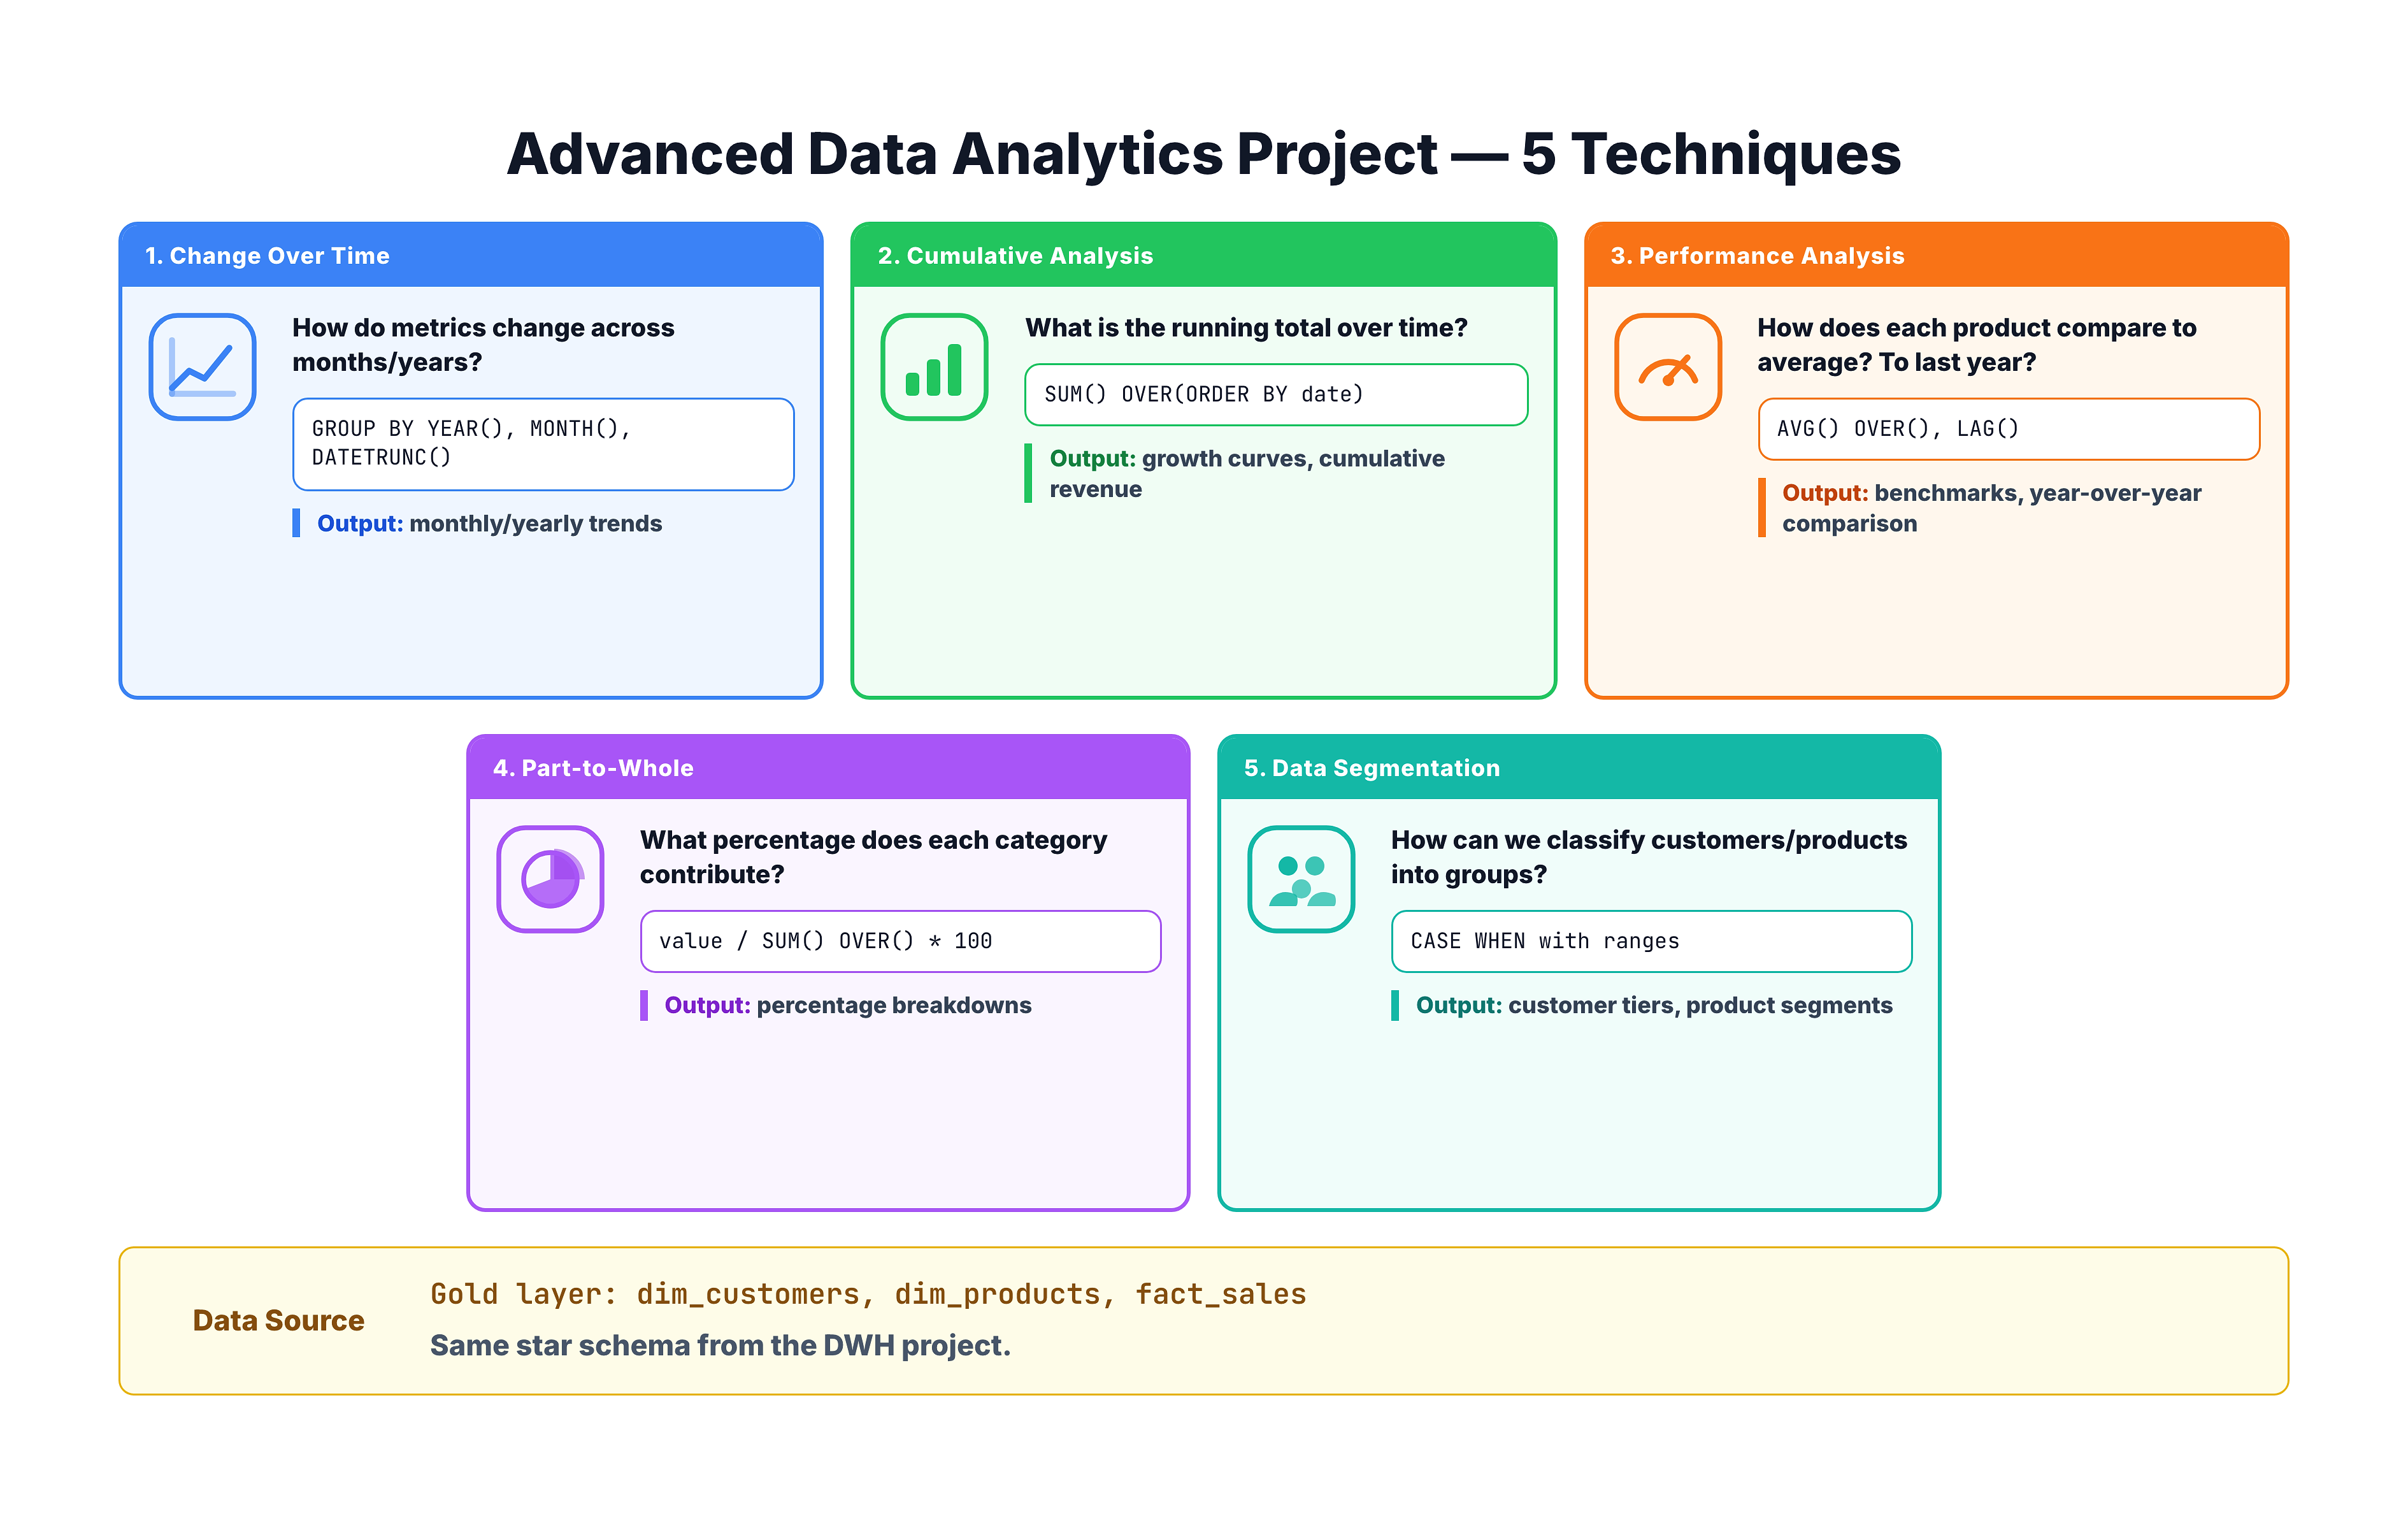
Advanced data analytics goes beyond simple aggregations (totals, counts, averages) and explores deeper patterns in the data. It answers questions like:
- How are things changing over time? — Are sales growing or declining month over month?
- What is the cumulative picture? — How much total revenue have we earned so far this year?
- How does performance compare? — Is a product performing above or below its average?
- What is the contribution of each part? — Which product category makes up the largest share of total sales?
- How can we group entities meaningfully? — Which customers are VIPs versus new customers?
These are the types of questions that businesses ask every day, and SQL is one of the most powerful tools for answering them.
Project Overview
This project is divided into the following analytical modules:
| Module | Technique | Business Question |
|---|---|---|
| 1 | Change Over Time | How are sales, customers, and quantities trending over months and years? |
| 2 | Cumulative Analysis | What is the running total of sales over time? |
| 3 | Performance Analysis | How does each product compare to its average and previous year? |
| 4 | Part-to-Whole Analysis | What percentage of total sales does each category contribute? |
| 5 | Data Segmentation | How can we group products by cost and customers by spending behavior? |
| 6 | Customer Report | How do we build a comprehensive view of customer metrics and KPIs? |
| 7 | Product Report | How do we build a comprehensive view of product metrics and KPIs? |
| 8 | Documentation | How do we organize and version our SQL work using GIT? |
Each module builds on the SQL skills you already have and introduces new analytical patterns.
The Data We Are Working With
We continue working with the Gold layer of our data warehouse — the clean, business-ready tables created in the previous project. Our three main tables are:
gold.dim_customers
Contains customer information:
customer_key— Surrogate key (unique identifier)customer_number— Business identifierfirst_name,last_name— Customer namecountry— Country of residencegender— Genderbirthdate— Date of birthcreate_date— When the customer record was created
gold.dim_products
Contains product information:
product_key— Surrogate keyproduct_name— Name of the productcategory,subcategory— Product classificationcost— Product costproduct_line— Product line groupingstart_date— When the product became available
gold.fact_sales
Contains transactional sales data:
order_number— Unique order identifierproduct_key,customer_key— Foreign keys to dimensionsorder_date,shipping_date,due_date— Key datessales_amount— Revenue from the salequantity— Number of items soldprice— Unit price
SQL Techniques You Will Use
Throughout this project, you will use a variety of SQL techniques:
| Technique | SQL Feature | Used In |
|---|---|---|
| Date Extraction | YEAR(), MONTH(), DATETRUNC(), FORMAT() | Change Over Time |
| Window Functions | SUM() OVER(), AVG() OVER() | Cumulative Analysis, Performance |
| Lag/Lead | LAG() | Performance Analysis (Year-over-Year) |
| Percentage Calculations | CAST(), SUM() OVER() | Part-to-Whole Analysis |
| Conditional Logic | CASE WHEN | Data Segmentation, Reports |
| CTEs | WITH ... AS | All modules |
| Aggregations | SUM(), COUNT(), AVG(), MIN(), MAX() | All modules |
| Date Arithmetic | DATEDIFF() | Customer and Product Reports |
If any of these feel unfamiliar, do not worry — each module explains the technique step by step before applying it.
How to Approach This Project
Here are some tips to get the most out of this project:
- Follow the order — Each module builds on concepts from the previous one
- Run every query — Do not just read the SQL, execute it and examine the results
- Experiment — After understanding each query, modify it (change the date granularity, switch the dimension, add a filter) to deepen your understanding
- Take notes — Write down interesting findings as you go
- Think about the business — For each query, ask yourself: "What business decision could this help with?"
Let's get started with our first analytical technique: Change Over Time Analysis.