Redis, Inside-Out
The sentence everyone says, and what it fails to explain
Ask why Redis is fast and you get the same seven words: it's fast because it's in memory. That is true, and it is close to useless — because it predicts nothing. It does not tell you why one thread is enough, why INCR is safe without a lock, why a single DEL can take your whole service down for a third of a second, or why version 6 added threads and deliberately kept them away from your commands.
This page is the chain that does explain all of that, and it starts from one measurement you can take yourself.
Scope: You have already met most of Redis's surface in this course, and none of it is repeated here: eviction and maxmemory-policy are Cache Eviction: LRU, LFU, TTL, FIFO; the sorted set's skip list is Skip Lists & Merkle Trees; the 16,384 fixed hash slots are Distributed Caching + Consistent Hashing and Consistent Hashing Deep-Dive; batching round trips is Write Batching & Buffering; the lock recipe and its famous argument are Distributed Locks & Leases; the probabilistic types belong to Bloom Filters, HyperLogLog and Count-Min Sketch; GEOADD is Geohash; fire-and-forget delivery is Pub/Sub: Broadcasting Events; and you already cached a slow endpoint with it in Codelab: Cache a Slow Endpoint with Redis. Choosing between Redis and Memcached is its own lesson later, in the decision part of this course. What was left for this page — in Key-Value Stores' own words — is "the single-threaded event loop and why it's still that fast."
Where the time actually goes
Here is the experiment. Ask a live Redis for one key, twenty thousand times, and record two numbers: what Redis says the command cost it, and what the caller actually waited. Redis keeps the first for you in INFO commandstats.
Measured against Redis 7.4.9 over loopback — the friendliest possible network:
Redis executes the GET            0.40 us
the client waits (median)        52.82 us
the client waits (p99)           82.25 us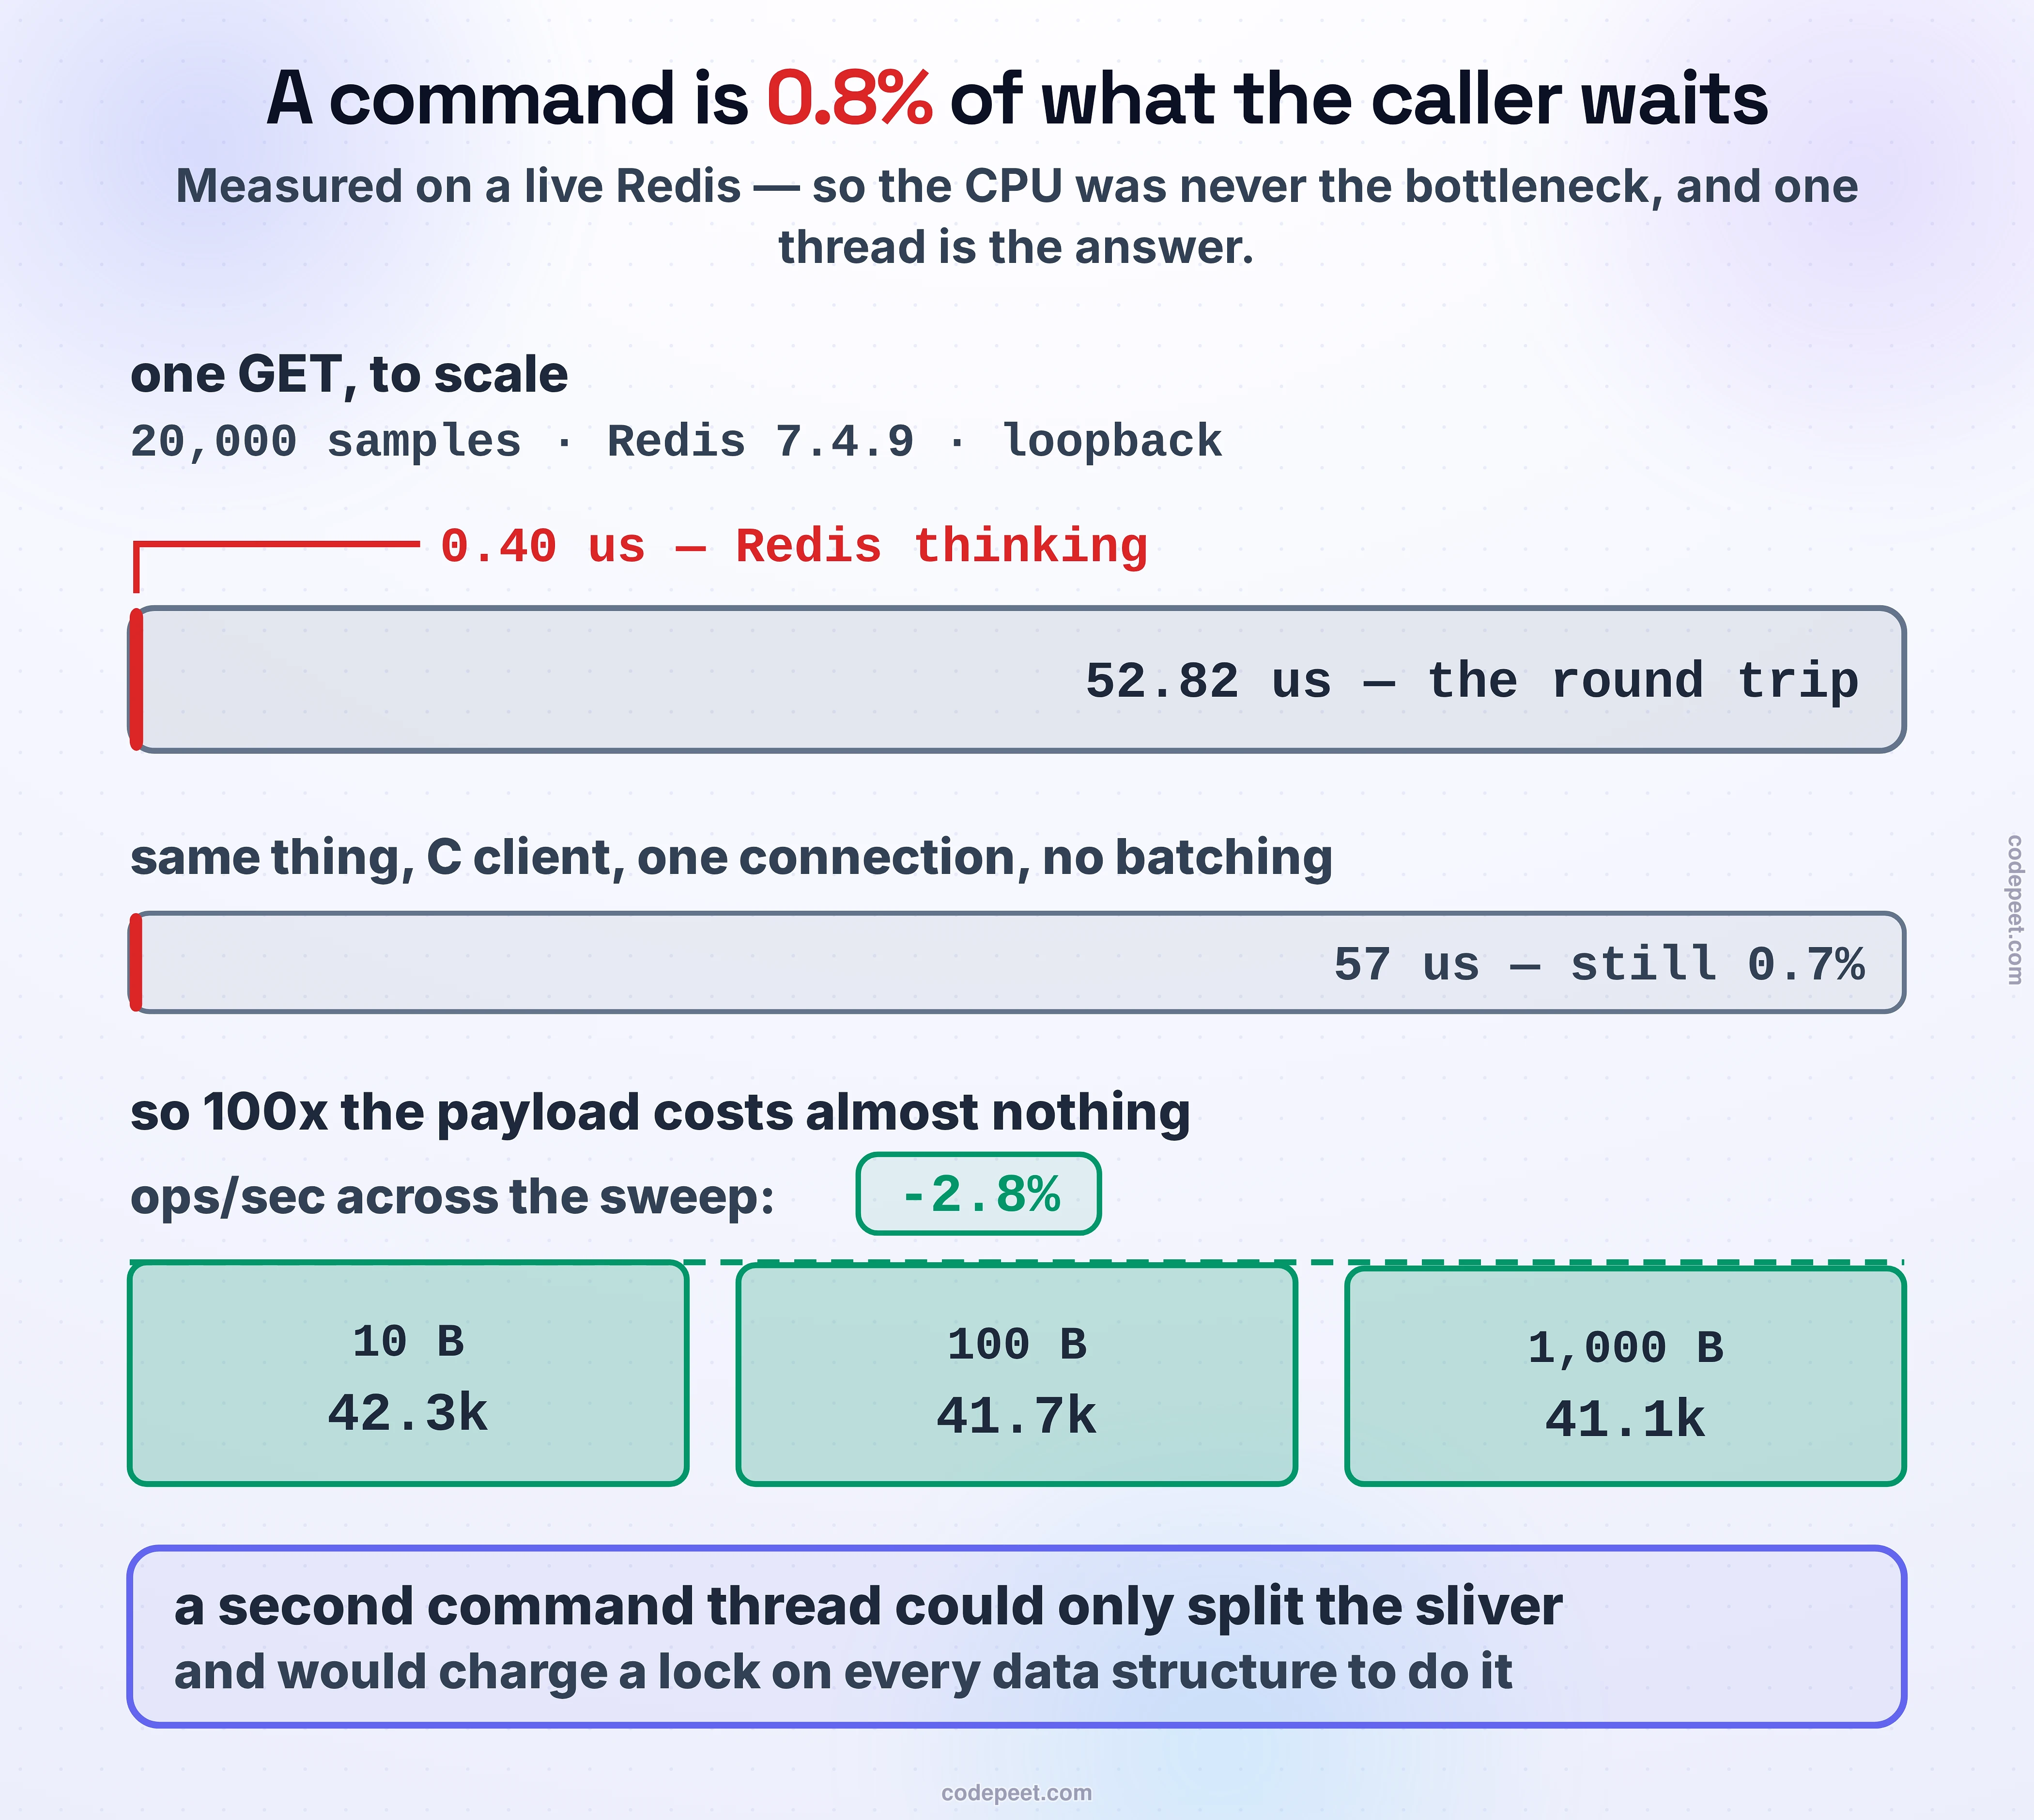
⭐⭐⭐ Executing the command is 0.8% of what the caller waits. Fifty-two microseconds out of every fifty-three are not Redis thinking.
Because that ratio is the entire lesson, it is worth defending against the obvious objection — you measured your client, not the server. So the same thing was measured again with redis-benchmark, a C client using hiredis, on one connection with no batching, where the round trip is exactly the reciprocal of throughput: 57 µs per operation at 17,519 ops/s — and execution is still 0.7% of it.
And there is a consequence that sounds wrong until you see the number. If you are paying for the trip rather than the bytes, then making the bytes bigger should barely matter. It barely matters:
| value size | ops/sec |
|---|---|
| 10 bytes | 42,254 |
| 100 bytes | 41,696 |
| 1,000 bytes | 41,068 |
A hundred times the payload costs 2.8% of the throughput. Redis's own documentation says the same thing from the other end: "in many real world scenarios, Redis throughput is limited by the network well before being limited by the CPU."
So one thread is not a limitation. It is the answer
Now put a second command-executing thread into that picture and ask what it buys.
It can only parallelise the 0.40 microseconds. It cannot parallelise the round trip, which is the other 99%. And to earn that fraction it would have to make every data structure in the process thread-safe — a lock or an atomic on every hash table bucket, every list node, every sorted set — paid on every single operation, including the overwhelming majority that were never contended.
⭐⭐⭐ Redis is single-threaded because it is in memory. Being in memory is what makes the CPU cheap; and once the CPU is cheap, the thread that would have hidden disk waits has nothing to hide, and the locks it would cost are pure loss.
That is not a rationalisation after the fact — it is visible in the hardware advice Redis gives. Most databases want many cores. Redis's documentation says it "favors fast CPUs with large caches and not many cores", and that if you want to use the other cores, you run more Redis instances, not more threads. A design that asks for fewer cores is telling you where it thinks the bottleneck is.
Two things follow. One is a gift and you have already spent it three times. The other is a bill, and it is the reason most Redis incidents look the way they do.
The gift: you have already relied on this three times
If exactly one thread ever touches the data, then every command is atomic by construction. Not atomic because someone implemented a lock — atomic because there is no second thread for it to race against. Redis never had to write the mutual exclusion; the architecture is the mutual exclusion.
Sixteen connections, two thousand INCR each, all on the same key, no lock and no retry anywhere:
16 concurrent connections x 2000 INCR on the SAME key
expected 32,000   ->   actual 32,000   EXACT   (0.86s)
Now look back at three designs this course already had you build, and notice that all three were quietly standing on that one fact:
- The rate limiter. Rate Limiting: Token Bucket, Leaky Bucket, Windows had you count with
INCRplusEXPIRE, and reach for a script when the decision needed to be one indivisible step. It works because no other command can interleave with yours. - The lock. Distributed Locks & Leases opened with a single
SETwithNXand an expiry. Check whether it exists, and set it if it doesn't is two operations in your head and one uninterruptible operation in Redis. - The contended counter. Flash Sale: Inventory Under Contention measured the atomic conditional write as the fastest of four strategies, and Pattern: Dealing with Contention explained the ceiling as roughly one over the hold time. Redis's hold time is the command itself — microseconds, inside one thread, with no round trip inside the critical section.
⭐⭐ This is the interview-grade version of "Redis is single-threaded." Anyone can say it. Saying what it buys you — that atomicity is free, so counters, limiters and locks need no coordination — is the sentence that reads as someone who has actually thought about it.
The bill: in Redis, your latency is not yours
One thread means one queue. Every client in the system is standing in it, and the thread serves them strictly one at a time. So the moment any client asks for something slow, every other client is behind it — not slowed down, stopped.
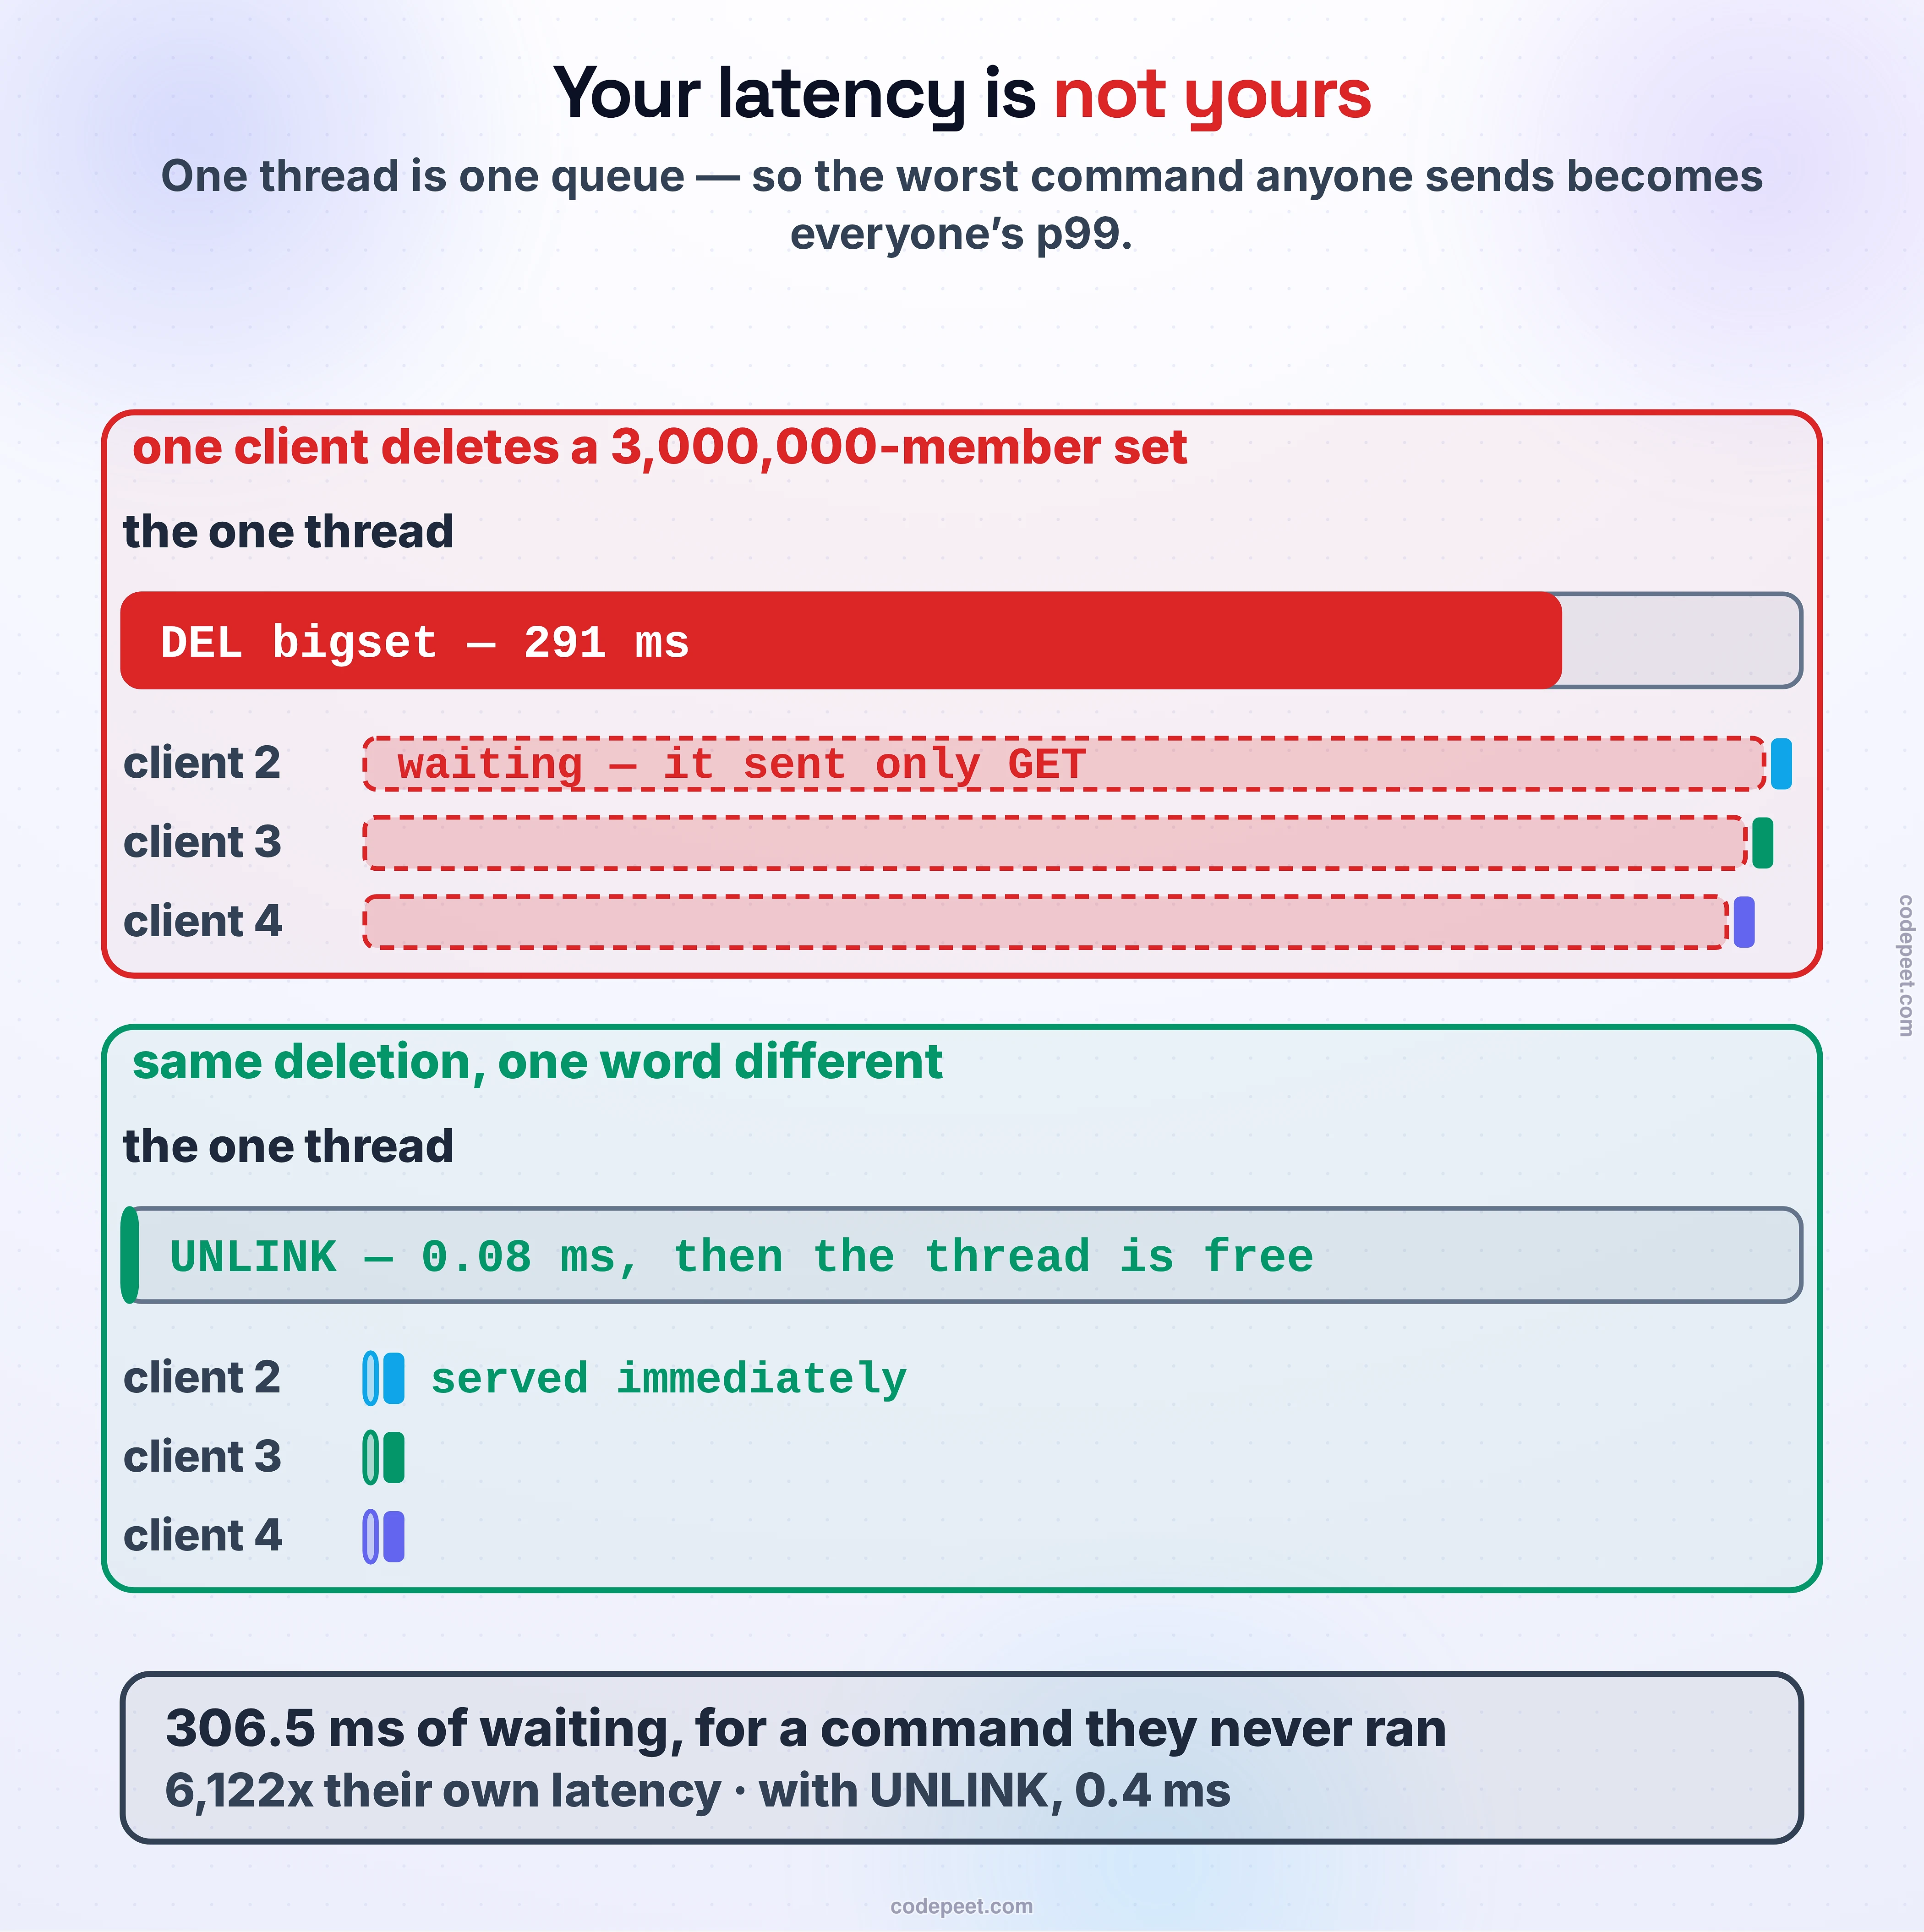
The experiment: one perfectly innocent client runs GET in a loop and records what it waits. Halfway through, a different client on a different connection deletes a three-million-element set. Nothing about the innocent client changes.
other client ran     it took   innocent p50   innocent p99   innocent WORST
DEL                  306.6ms       0.050ms        0.085ms         306.5ms
UNLINK                 0.3ms       0.051ms        0.082ms           0.4ms
⭐⭐⭐ A command it never ran, on a key it never touched, cost the innocent client 307 milliseconds — 6,122 times its own normal latency.
That single number reframes how you have to reason about Redis. Your p99 is not a property of your queries. It is a property of the worst query anyone sends. A team two floors away can ruin your latency budget with one line of code, and nothing in your own metrics will explain it.
The second row is the fix and it is one word. UNLINK removes the key from the keyspace immediately and reclaims the memory on a background thread — so the work still happens, it just stops happening in the queue everybody is standing in. Same deletion, 307 ms down to 0.4 ms for everyone else.
And because every command shares that one thread, it is worth knowing what each one actually costs it. Measured on the same instance, against a 300,000-key keyspace with a 3-million-member set, a 1-million-element list and a 500,000-field hash:
| command | thread time |
|---|---|
GET one key | 0.051 ms |
SCAN / HSCAN, one bite | 0.124 / 0.169 ms |
KEYS * over 300k keys | 197 ms |
DEL a 3M-member set | 291 ms |
LRANGE list 0 -1, 1M elements | 531 ms |
HGETALL a 500k-field hash | 616 ms |
UNLINK the same 3M-member set | 0.084 ms |
⭐⭐ Twelve thousand times between the cheapest and the dearest — and one thread serves all of them, in the order they arrived. Note which one is worst:
HGETALLis not an exotic command, it is what everybody writes the first time they store a hash.
The family of these is small enough to memorise, and knowing it is worth a lot in a room:
| the command that stalls | what it does on the one thread | reach for |
|---|---|---|
KEYS * | walks the entire keyspace | SCAN — a cursor, in small bites |
DEL bigkey | frees every element inline | UNLINK — free it in the background |
HGETALL / SMEMBERS on a huge collection | serialises the whole thing at once | HSCAN / SSCAN |
FLUSHALL | drops everything inline | FLUSHALL ASYNC |
| a Lua script with a loop in it | runs to completion, uninterrupted | keep scripts tiny and bounded |
⭐ Notice the shape they share. None of these is slow because Redis is slow. Each one is a small amount of work multiplied by a collection that grew quietly over months. The big key is the bug; the command is only where it surfaces.
Drive it: four clients, one thread
Reading that DEL froze an unrelated client is not the same as watching it happen. Below, four clients share one Redis exactly as they do in production: you choose what each one sends, and the queue in front of the single thread is drawn as it really behaves.
Try this first. Set all four to ordinary GETs and watch the queue stay empty and every latency stay flat. Then change one client — just one — to DEL on a big key, and watch what happens to the other three, who did nothing. Then switch that same client to UNLINK and watch the damage disappear without the work disappearing.
The toggle worth playing with last is io-threads, and it is there to make a point rather than to be a fix: turning it on speeds up the reading and writing of sockets and does nothing at all for the client stuck behind a slow command — because the slow command is not socket work. That is the next section, and the drill will have already shown you the answer.
The other stall: persistence has to fork
There is a second way the one thread gets taken away from you, and it is the one people are least ready for, because it happens on a schedule nobody chose.
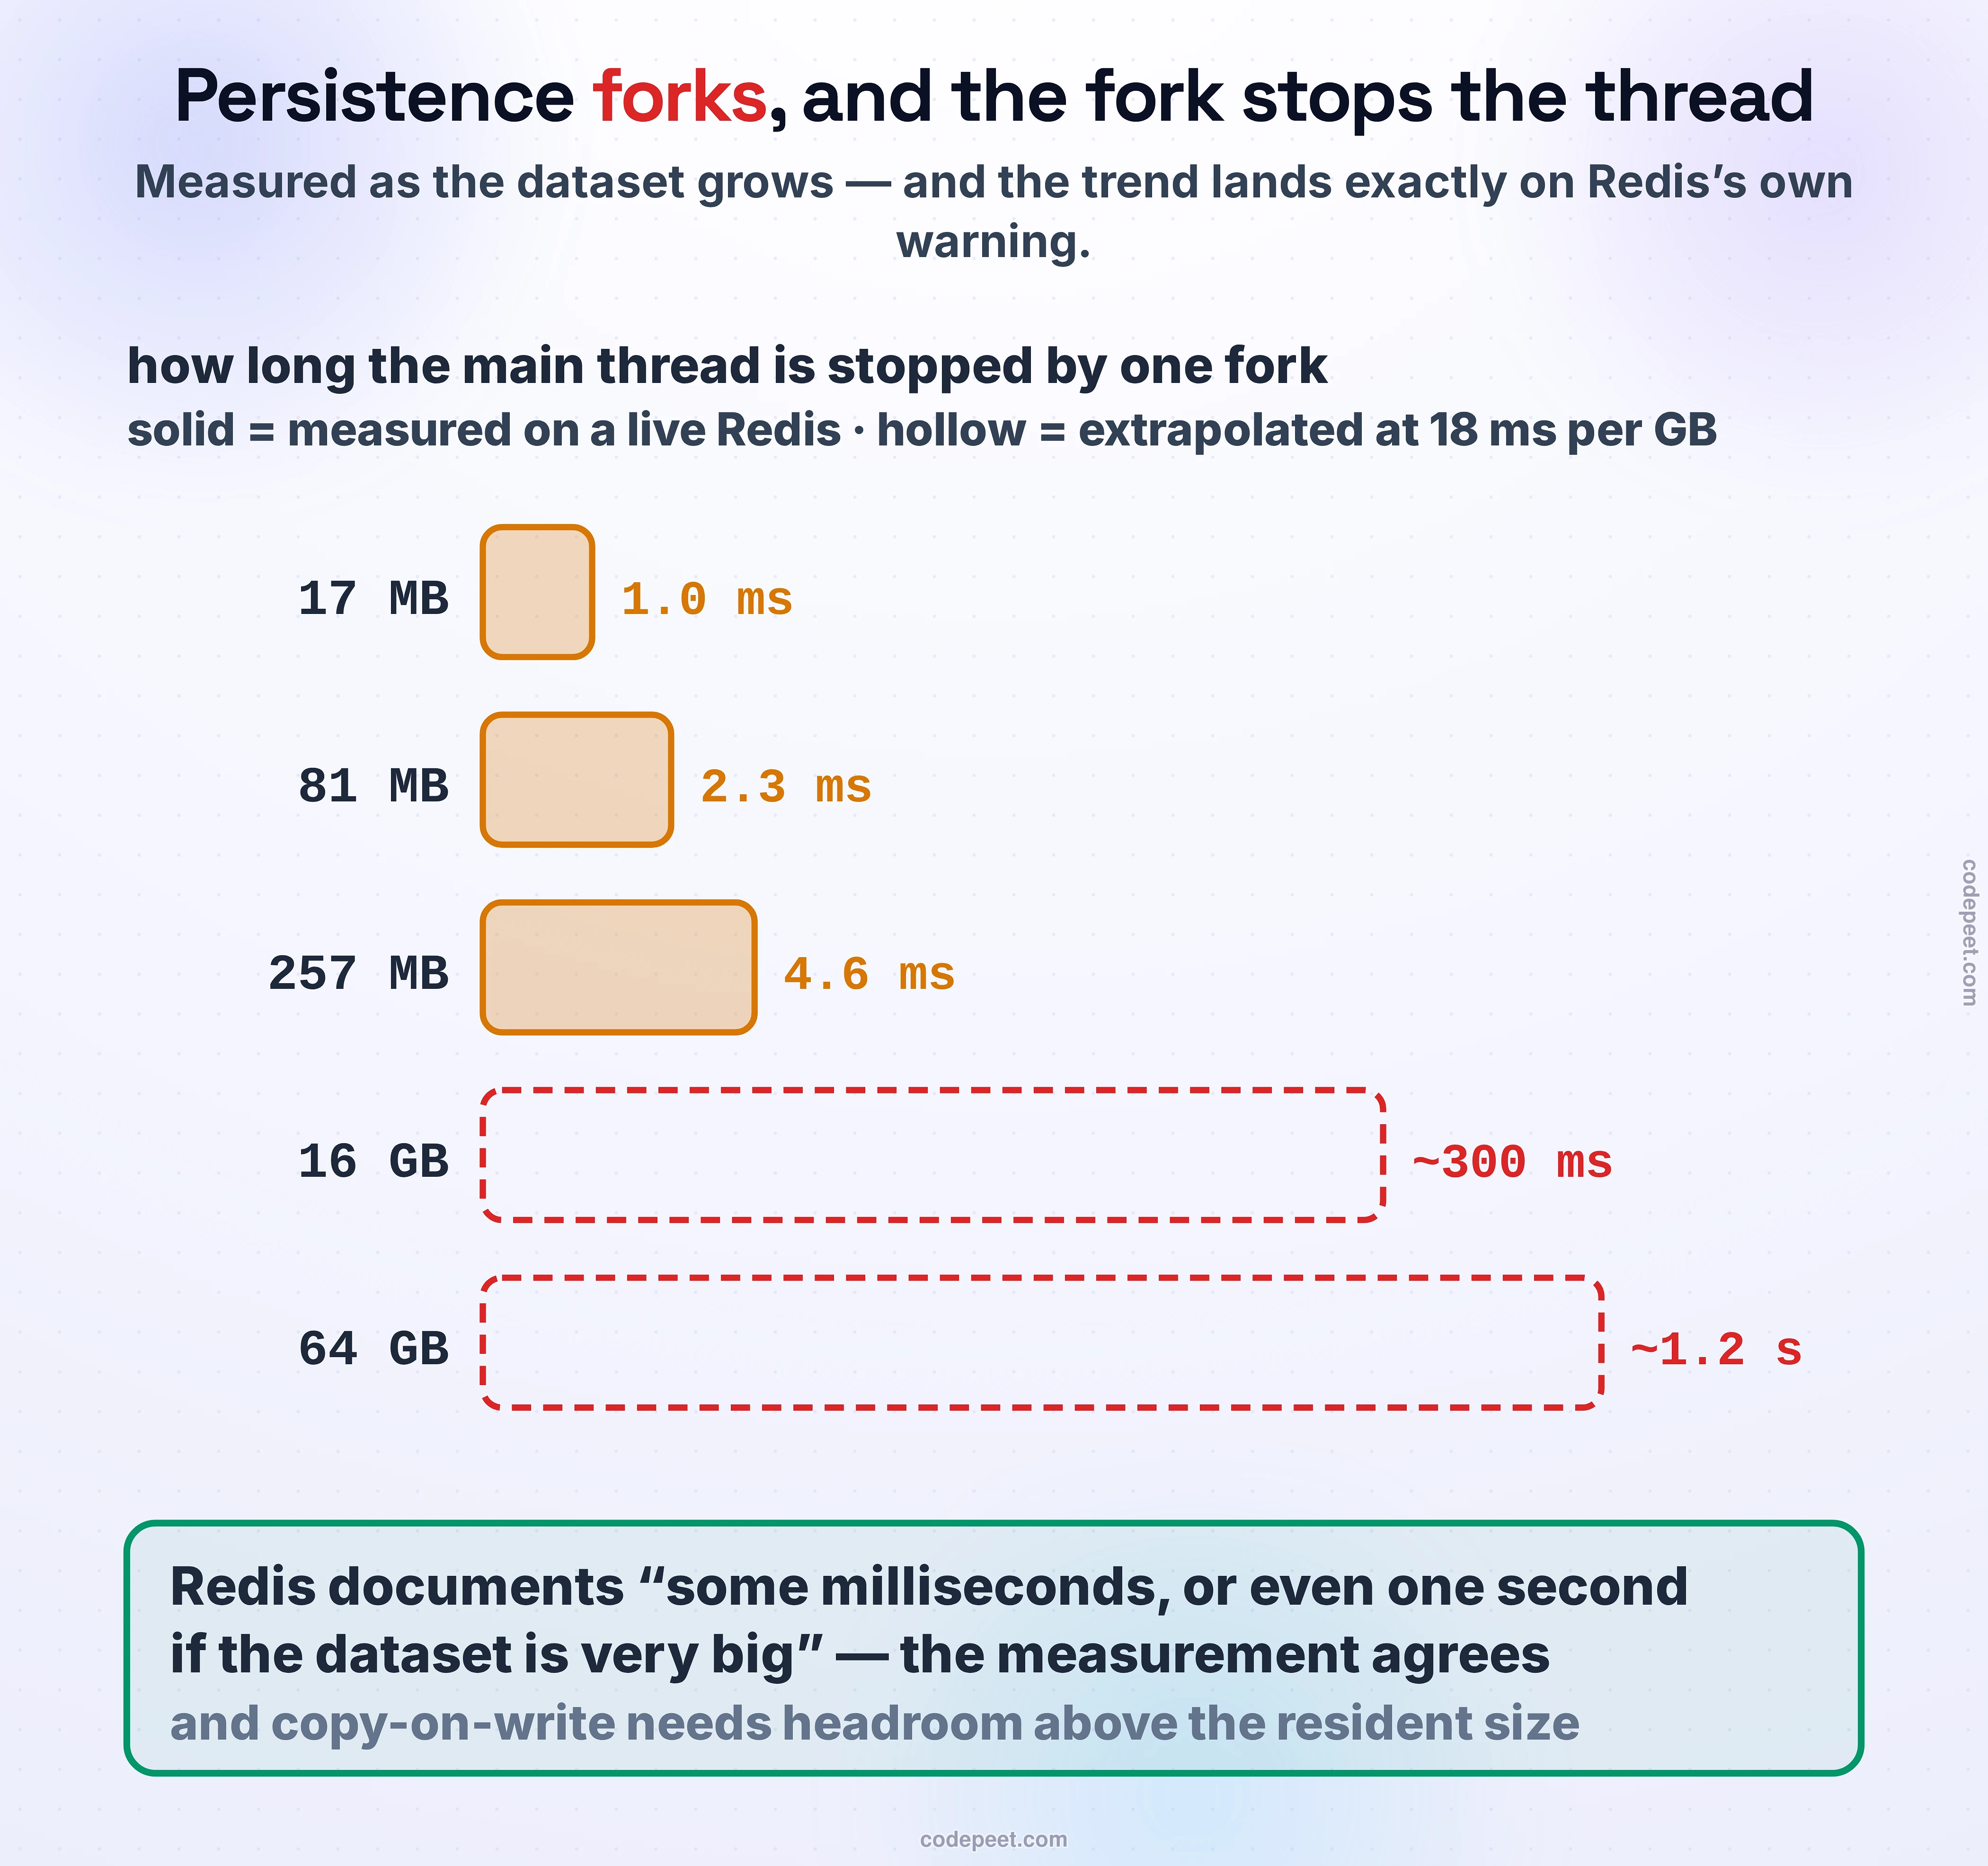
To write a snapshot without stopping the world, Redis calls fork(). The child gets a frozen view of memory and writes it to disk at its leisure; the parent carries on serving. That is copy-on-write and it is genuinely clever. But fork() itself is not free — the kernel has to build the child's page tables, and the parent is stopped for the whole of it. Redis's own documentation is blunt: fork() "can be time consuming if the dataset is big, and may result in Redis stopping serving clients for some milliseconds or even for one second if the dataset is very big."
Measured, on the same instance, as the data grows:
       keys      dataset    fork took     per GB
    200,000         17MB        1.0ms       61ms
  1,000,000         81MB        2.3ms       29ms
  3,000,000        257MB        4.6ms       18ms
The per-gigabyte cost improves with size — a fixed setup cost amortising — so extrapolate from the largest point, which is the conservative choice: at 18 ms per gigabyte, a 16 GB instance stalls for about 0.3 s and a 64 GB instance for about 1.2 s. Which lands exactly on the figure Redis documents, arrived at from a measurement rather than from the manual.
Three consequences that are worth saying out loud:
- A snapshot is a latency event, not just a disk event. If your p99 has a spike every few minutes with no traffic pattern behind it, look at your save points before you look at your queries.
- Copy-on-write means memory can grow while the child runs. Every page the parent writes to during the snapshot has to be duplicated. A write-heavy instance mid-snapshot needs headroom above its resident size — which is why "size the box to the dataset" is not enough.
- Replicas fork too. A replica syncing from scratch triggers a snapshot on the primary, so adding a replica during an incident is not the free operation it looks like.
What actually survives a crash
Key-Value Stores told you the honest edge — a bare Redis "can lose acknowledged writes in a crash window." Here is the window, and how you choose its size.
There are two mechanisms and they answer different questions.
Snapshots (RDB) are a point-in-time copy of the whole dataset, produced by the fork above. Compact, fast to load, ideal to ship somewhere else as a backup. The window is however long ago the last snapshot was — commonly minutes.
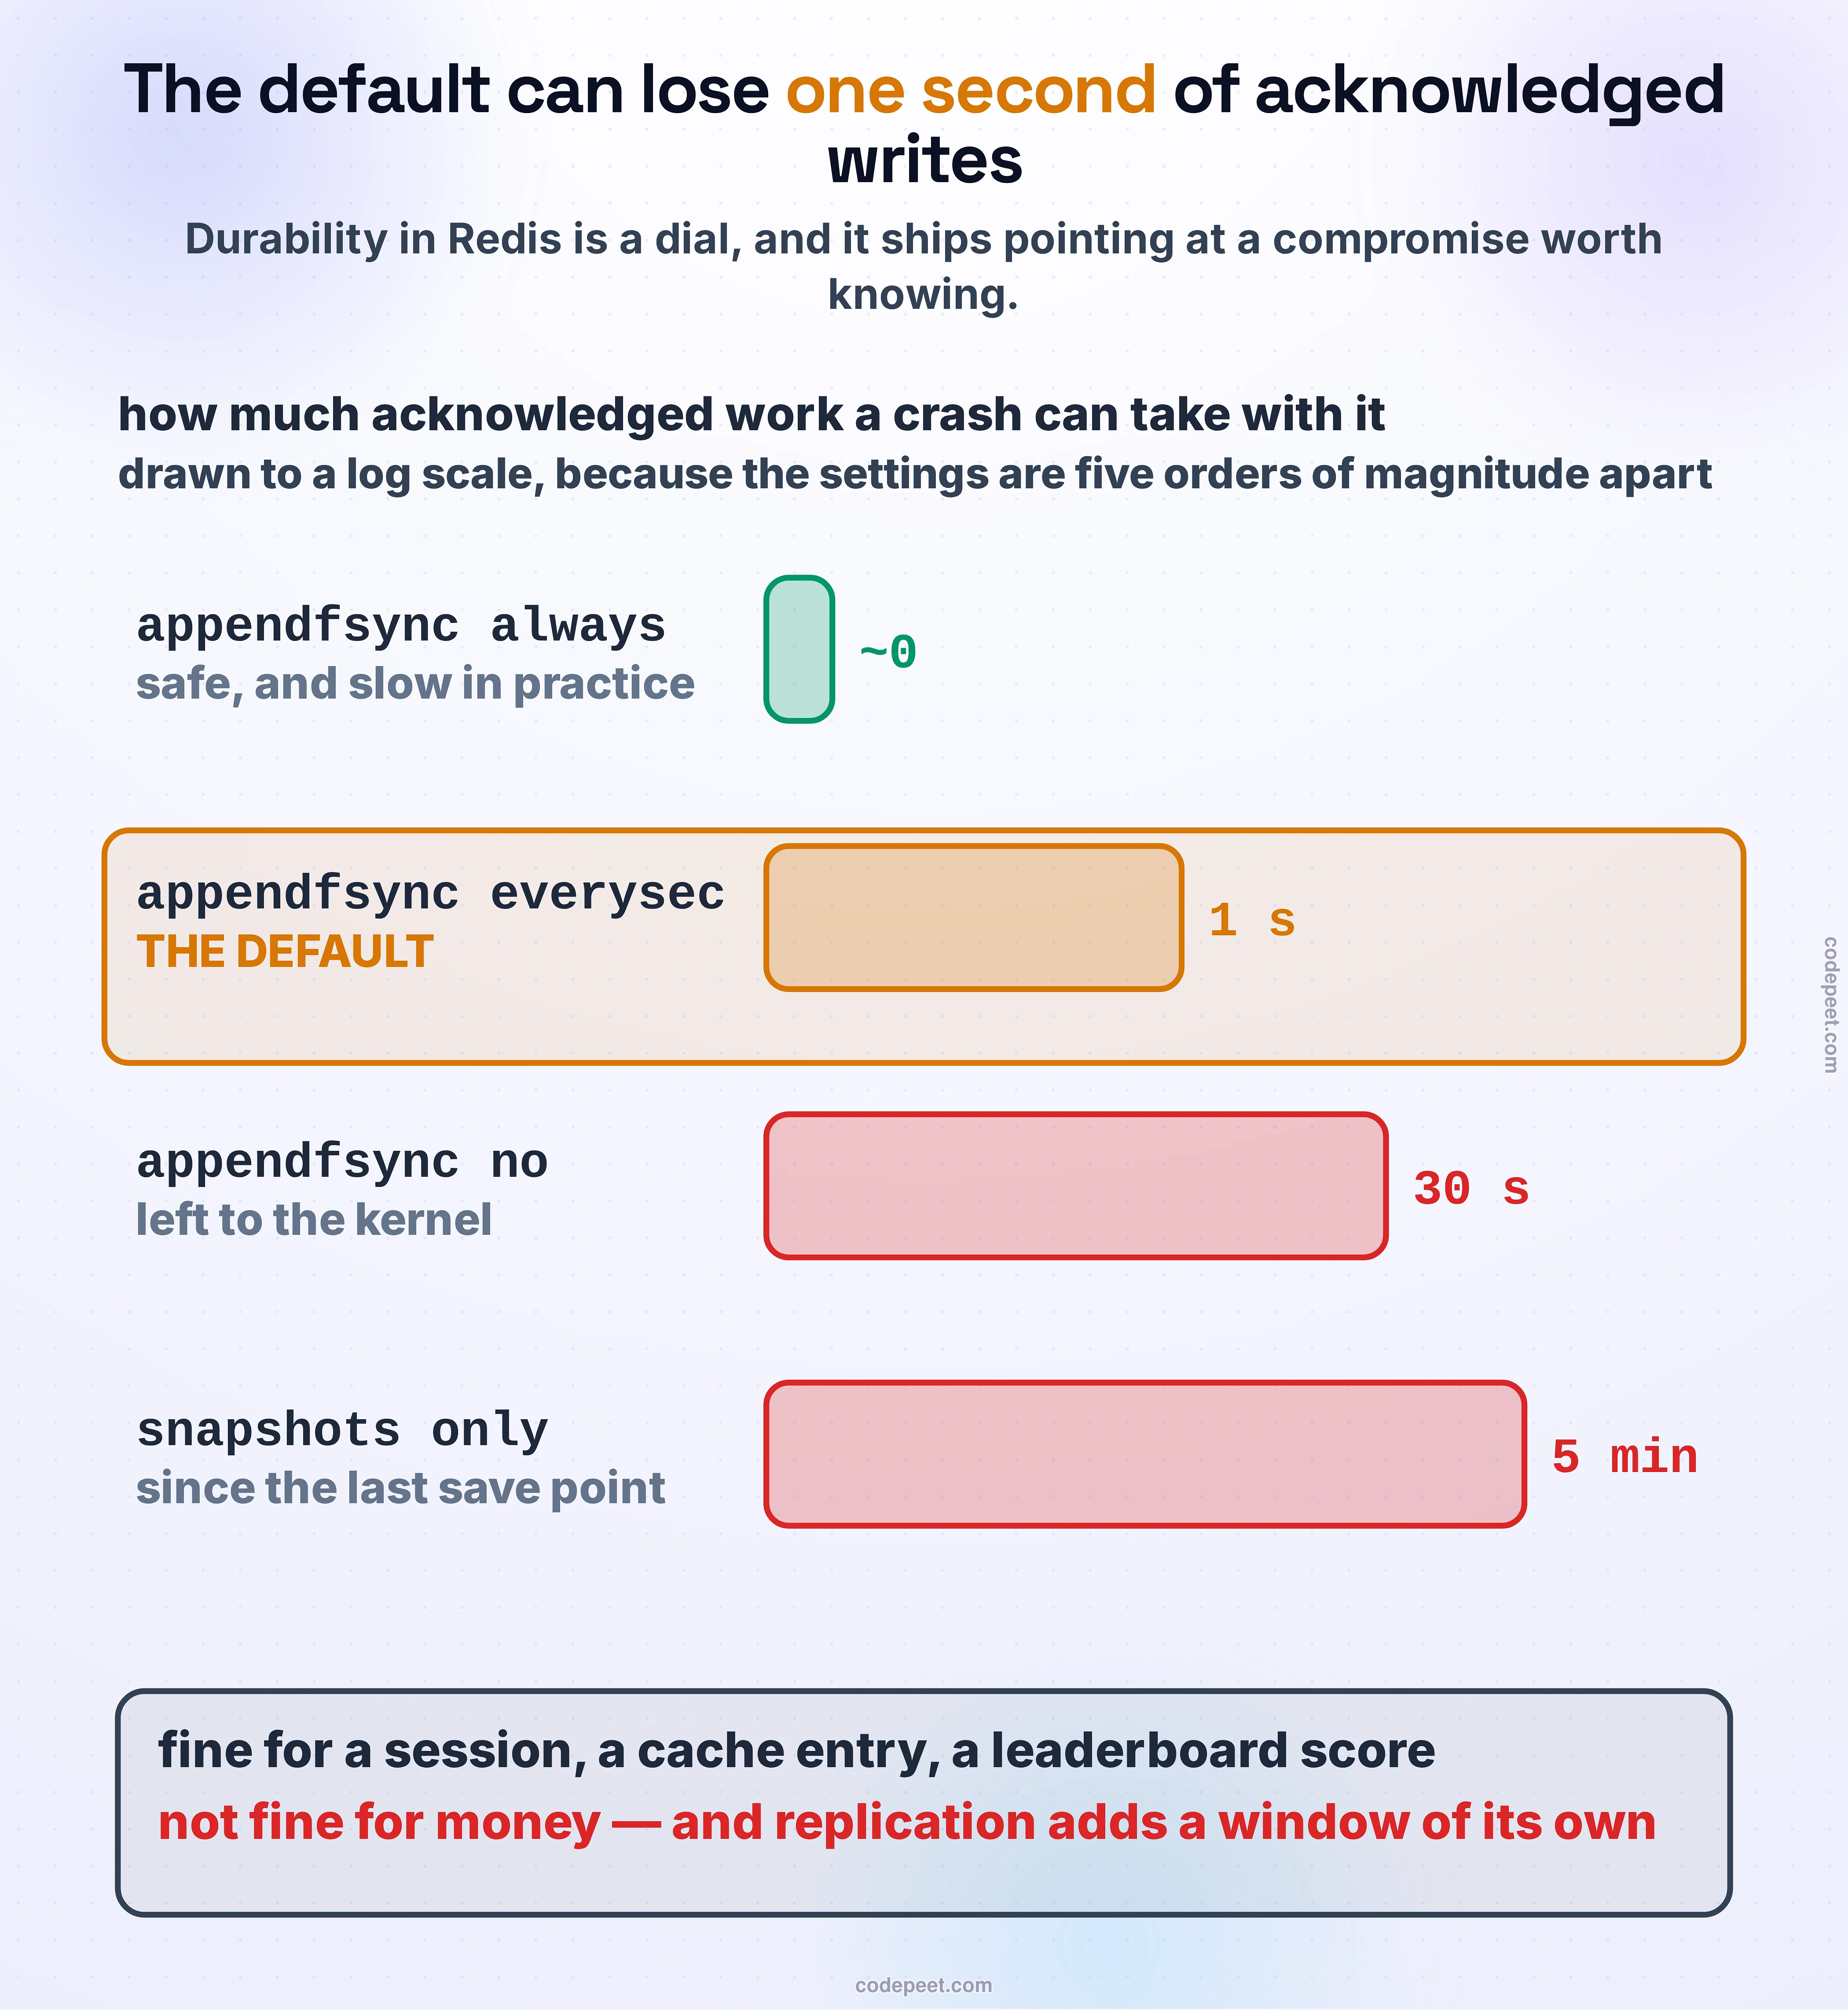
The append-only file (AOF) logs every write command as it arrives and replays them at startup. Bigger than a snapshot, slower to load, and much narrower a window — but how narrow is a setting, and this is the setting to know:
appendfsync | what it does | what you lose in a crash |
|---|---|---|
always | flushes to disk before replying | essentially nothing — and it is "very slow in practice" |
everysec (default) | flushes once a second, on a background thread | up to one second of acknowledged writes |
no | leaves it to the operating system | whatever the kernel had not flushed — typically ~30 s |
⭐⭐⭐ The default is
everysec, so the honest sentence about a default Redis is: it can acknowledge your write and lose it, up to a second's worth. That is a completely reasonable trade for a session, a cache entry, or a leaderboard score. It is not a reasonable trade for money, and saying so unprompted is one of the strongest things you can do with this technology in an interview.
Three details that separate a real answer from a recited one:
- Redis discourages AOF alone — not for durability, but because a snapshot is what gives you backups, fast restarts, and a fallback if the log engine itself has a bug. The recommended posture when you care is both.
- Since 7.0 the AOF is multi-part: a base file plus incremental files tracked by a manifest, so a rewrite no longer has to buffer every concurrent write in memory and write it twice. If someone quotes the old memory-spike warning, that is the version it belongs to.
- Persistence is not replication, and neither is a backup.
fsyncprotects you from the process dying. It does nothing about the disk dying, and replication — being asynchronous — has a loss window of its own that stacks on top of this one.
Then why did version 6 add threads?
This is the question that catches people, because it sounds like it contradicts everything above. It does the opposite — it confirms it.
Look again at where the time went. If 99% of the wait is getting bytes on and off sockets, then the thing worth parallelising is getting bytes on and off sockets. So that is precisely, and only, what was threaded:
- an I/O thread reads from the client socket and parses the command;
- the main thread executes it — still alone, still holding the only reference to the data;
- an I/O thread writes the reply back.
⭐⭐
io-threadsnever execute commands. They do the reading, the parsing and the writing. Command execution has never been parallel and is not parallel now — which is why everything above about atomicity and about the shared queue is still true on a modern instance.
The payoff is exactly what the measurement predicted: Redis reports up to 112% more throughput with eight I/O threads on a multi-core machine, after the model was rebuilt in 8.0. Roughly double, from threading the part that was 99% of the time — and zero help for the client stuck behind a big DEL, because that was never socket work.
⭐ If an interviewer says "but Redis is multi-threaded now", that distinction is the whole answer: threaded at the sockets, single-threaded at the data, on purpose.
Why you would pick it, in one breath
The version you say out loud when Redis is the right call, in about twenty seconds:
"I'd put Redis here because the access is key-shaped and the working set fits in RAM. A command costs under a microsecond of CPU, so the whole latency is the round trip — which is why a single node does on the order of a hundred thousand operations a second and why it's single-threaded. That single thread also makes every command atomic, so the counter and the lock need no coordination. The costs I'd watch are that one slow command blocks every client, so no unbounded
KEYSorDELon big keys, and that with the default persistence I can lose about a second of acknowledged writes — fine for this data, and if it weren't, this isn't the store."
And when to say no, which is the half candidates skip:
- The working set does not fit in memory. Redis is not a disk database with a cache in front; the data is the memory. Once you are evicting things you needed, you have bought an expensive way to miss.
- It is the system of record for something that must not be lost. Between the persistence window and asynchronous replication, an acknowledged write can vanish.
- The questions vary. The moment you want "every order from restaurant 7 last month", you are asking a query, and you are now the query planner — which Key-Value Stores already showed you the price of.
- You need durable, replayable history with long retention. Streams are real, and they are still only as durable as the settings above.
Follow-up ammo
Three questions an interviewer reaches for once you name Redis, and what a strong answer sounds like. Commit to your own answer before reading each one.
1 · "You said it's single-threaded. Isn't that a bottleneck?"
"Not for throughput — a command is well under a microsecond of CPU and the round trip is fifty-plus, so the network saturates long before the core does. It's a bottleneck for tail latency, and in a specific way: because there's one queue, one slow command blocks every client. I'd keep an eye on big keys, use
SCANandUNLINKrather thanKEYSandDEL, and if I genuinely needed more cores I'd run more instances rather than expect more threads."
2 · "What happens when this Redis dies?"
"Two separate questions — what's lost, and what's broken. Lost: with the default
appendfsync everysecI can lose about a second of acknowledged writes, and replication is asynchronous so a failover can lose a bit more. Broken: whatever I put behind it now takes the full load, so I'd want the cache miss path to survive that — a time budget on the call so a hanging Redis doesn't hang my request, and single-flight so the rebuild isn't a stampede."
3 · "Why not just add a second thread and double the throughput?"
"Because the thread would be idle. The measured split is under a microsecond of execution inside a fifty-microsecond round trip, so a second command thread parallelises the 1% and charges a lock on every data structure for the privilege. That's exactly why
io-threads— which is real and does help — was applied to socket reads and writes and never to command execution."
Take it into the room
- ⭐⭐⭐ A command is 0.40 µs of CPU inside a ~52 µs round trip — 0.8%. Cross-checked with a C client at 57 µs and 0.7%. The CPU was never the bottleneck, which is the whole reason one thread is enough.
- ⭐⭐⭐ Redis is single-threaded because it is in memory — being in memory is what makes the CPU cheap, and once it is cheap a second command thread buys 1% and costs a lock on every structure. Redis asks for fast cores, not many; extra cores get extra instances.
- ⭐⭐⭐ Atomicity is free, and you already spent it three times — the rate limiter's
INCR, the lock'sSET NX, and the flash sale's conditional write are all correct because no second thread exists to race them. - ⭐⭐⭐ Your latency is not yours. Measured:
DELon a 3M-element set froze an unrelated client for 307 ms, 6,122× its normal latency.UNLINK— same deletion, background reclaim — left it at 0.4 ms. Learn the family:SCANoverKEYS,UNLINKoverDEL,HSCAN/SSCANoverHGETALL/SMEMBERS,FLUSHALL ASYNC. - ⭐⭐ The big key is the bug, not the command. These stalls are ordinary work multiplied by a collection that grew quietly.
- ⭐⭐ Persistence forks, and the fork stalls the same thread. Measured 1.0 / 2.3 / 4.6 ms at 17 / 81 / 257 MB — about 18 ms per GB at the top end, so roughly 1.2 s on a 64 GB instance, matching Redis's own warning. Copy-on-write also needs headroom, and a replica's first sync forks the primary.
- ⭐⭐⭐ The default durability window is one second (
appendfsync everysec).alwaysis safe and slow;noleaves you at the kernel's mercy, roughly 30 s. Redis discourages AOF alone — keep snapshots for backups and fast restarts. - ⭐⭐
io-threadsnever execute commands — sockets and parsing only, up to 112% more throughput on eight threads. "Redis is multi-threaded now" is half a sentence; the other half is at the sockets, not at the data. - ⭐ Payload size barely matters below the packet size — 100× the bytes cost 2.8% of the throughput, because you were paying for the trip.
Next, the store that answers the opposite question — where the data is on disk, the questions vary, and a planner does the thinking for you: PostgreSQL, Inside-Out.