Introduction to UML — Why Visual Modeling Matters
Introduction
Imagine you're hiring an architect to build your house. Before a single brick is laid, they hand you a set of blueprints — floor plans, elevation drawings, electrical diagrams, plumbing layouts. Each blueprint shows the same house from a different perspective.
You wouldn't start construction without blueprints. Yet in software, developers routinely jump straight into code without any visual plan — and then wonder why the system becomes tangled, hard to change, and impossible for new team members to understand.
UML (Unified Modeling Language) is the blueprint language for software. It gives you a standardized way to draw the structure, behavior, and interactions of your system before — and after — you write code.
In this section (S5), you'll learn to read and draw the five most important UML diagrams. We'll use a single example — a Library Management System — across every tutorial so you can see how the same system looks through five different lenses.
What is UML?
UML stands for Unified Modeling Language. It's a standardized visual notation for describing the design of software systems. Three key facts:
-
It's a language, not a methodology. UML tells you how to draw diagrams — it doesn't tell you when to draw them or what process to follow. You can use UML whether you practice Agile, Waterfall, or anything in between.
-
It was created by unifying competing notations. In the early 1990s, every software engineer had their own diagram style. Grady Booch, James Rumbaugh, and Ivar Jacobson — three pioneers of object-oriented design — merged their separate notations into one standard in 1997. The Object Management Group (OMG) now maintains UML as an ISO standard.
-
It has 14 diagram types, but you only need 5-6 in practice. The full UML spec is enormous. In LLD interviews and real-world design, you'll use a small, powerful subset. This section covers the five diagrams that matter most.
Why Visual Modeling Matters
The Communication Problem
Code is precise — but it's terrible at communicating design intent. Consider this scenario:
You join a team maintaining a 200,000-line e-commerce platform. Your first task: add a new payment method. You need to understand:
- Which classes handle payments?
- How does a payment flow through the system?
- What states can an order be in?
- Who are the actors that interact with payments?
You could spend days reading source code. Or you could look at four diagrams and understand the design in 30 minutes.
What Visual Models Give You
- Shared understanding: A diagram on a whiteboard aligns an entire team in minutes. Code cannot do this.
- Abstraction: Diagrams hide implementation details and show the big picture — relationships between components, not the 47 private helper methods inside them.
- Early error detection: Drawing a class diagram forces you to think about relationships before coding. You discover design flaws when they're cheap to fix (on paper), not expensive to fix (in production).
- Documentation that survives: Code comments rot. README files go stale. A well-drawn class diagram remains accurate because it maps directly to the code structure.
- Interview necessity: In LLD interviews, you're expected to draw UML diagrams. The interviewer uses them to evaluate your design thinking. No diagrams = no way to communicate your design.
The Two Categories of UML Diagrams
UML diagrams fall into two broad categories:
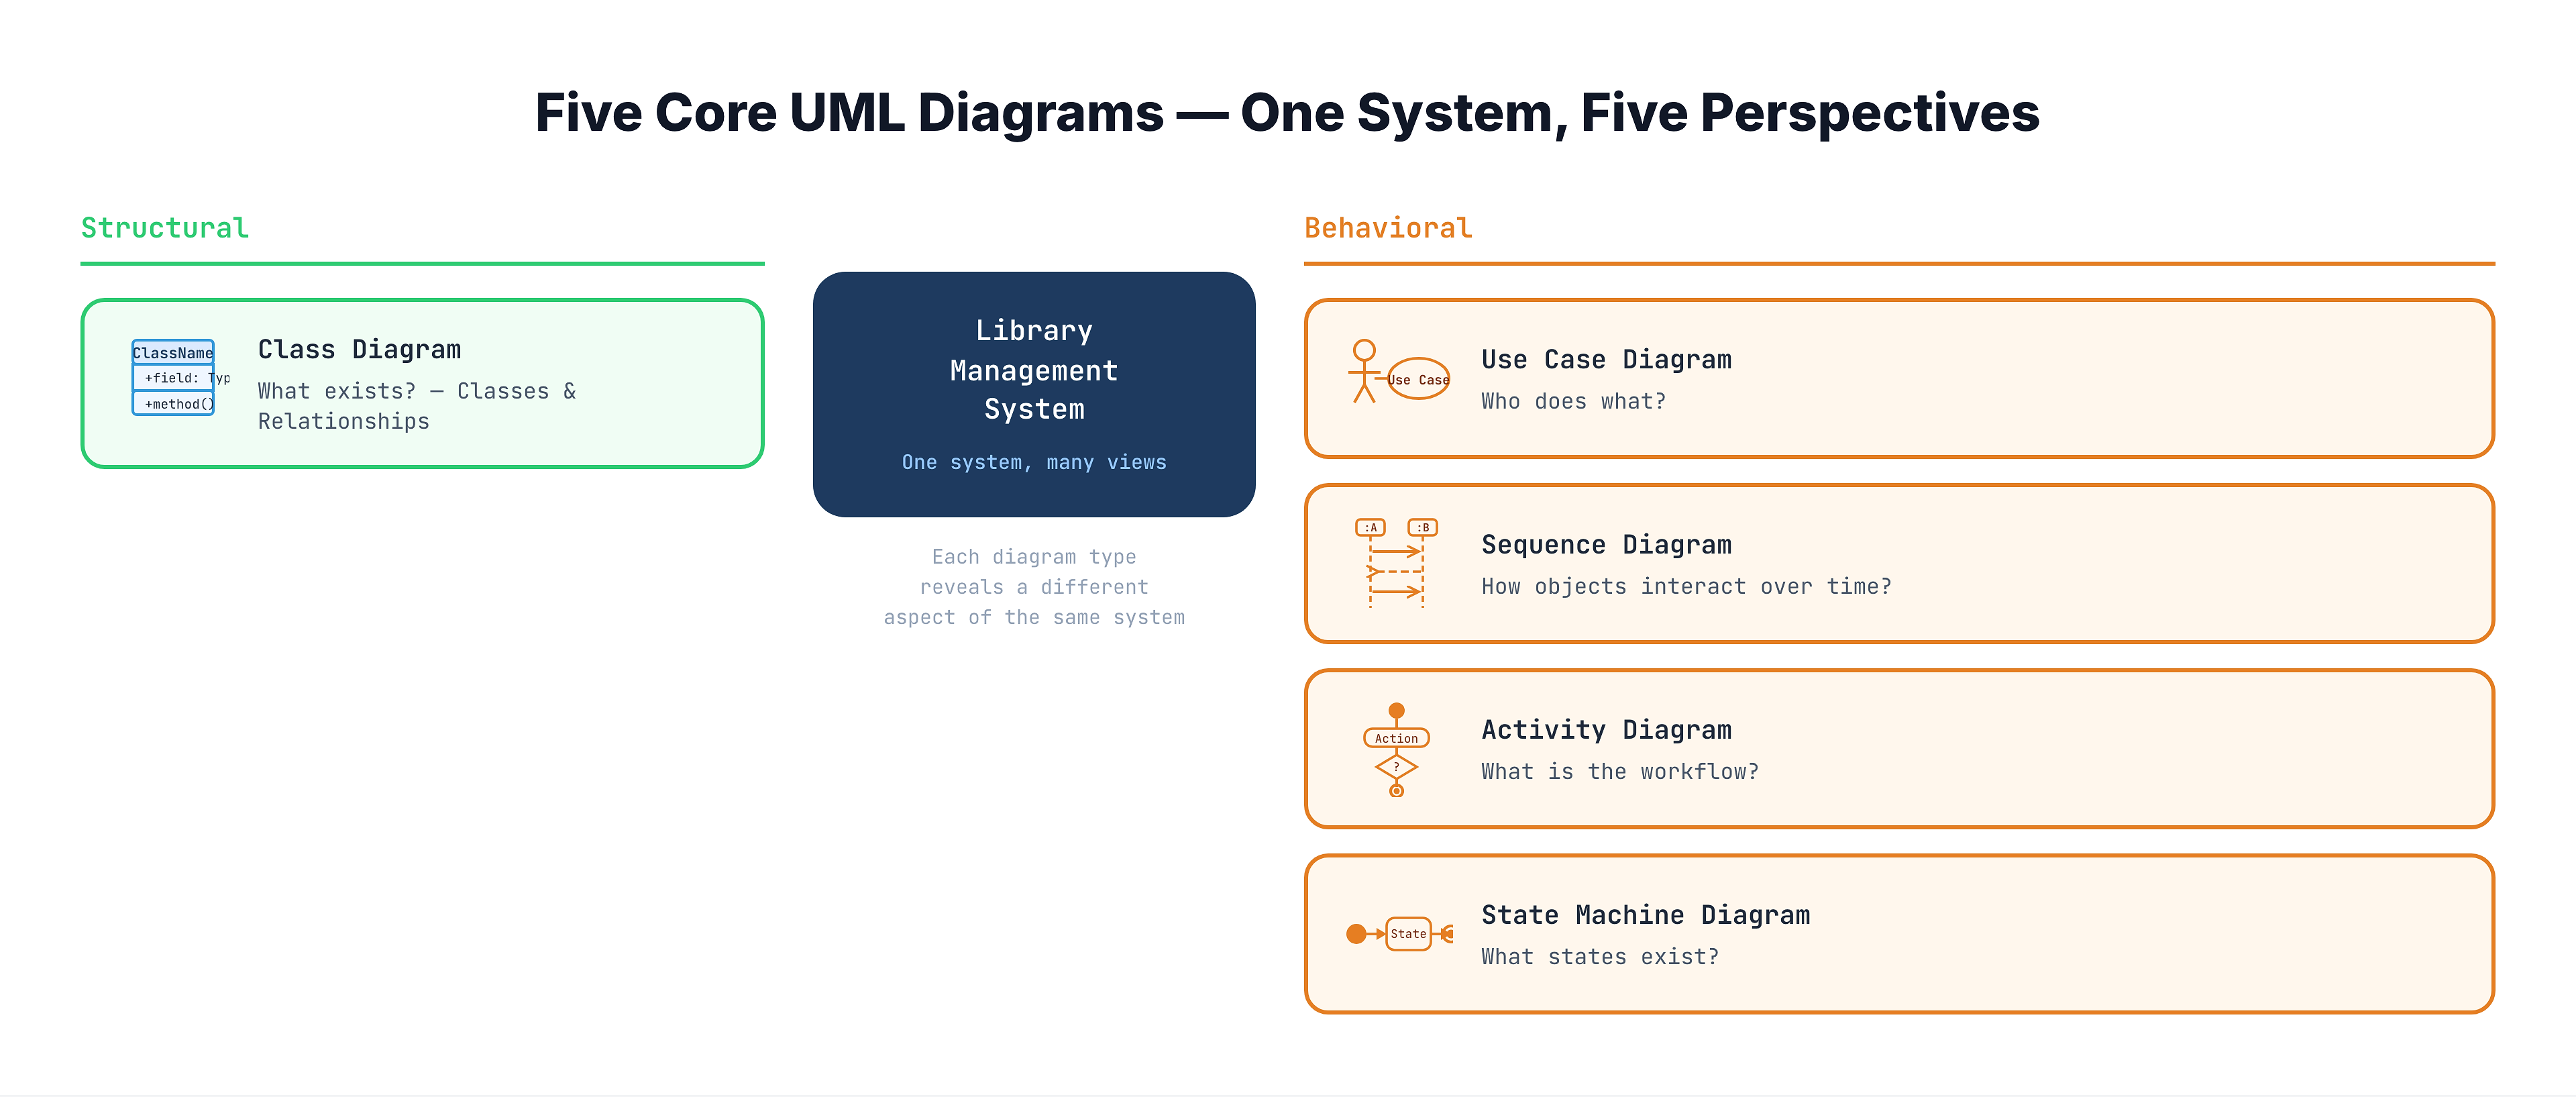
Structural Diagrams — "What exists?"
Structural diagrams capture the static architecture of your system. They answer: What are the building blocks, and how are they related?
The key structural diagram you'll learn:
- Class Diagram — The most important UML diagram. Shows classes, their attributes and methods, and relationships (inheritance, composition, association, dependency). Think of it as the floor plan of your system.
Behavioral Diagrams — "What happens?"
Behavioral diagrams capture the dynamic behavior of your system. They answer: How do things change? Who does what? What sequence of events occurs?
The key behavioral diagrams you'll learn:
- Use Case Diagram — Shows actors (users, external systems) and the actions they can perform. Think of it as the feature list from the user's perspective.
- Sequence Diagram — Shows how objects send messages to each other over time. Think of it as a conversation transcript between objects.
- Activity Diagram — Shows workflows with decisions and parallel paths. Think of it as a flowchart on steroids.
- State Machine Diagram — Shows the lifecycle states of a single object and what triggers transitions. Think of it as the life story of an object.
The Five Diagrams at a Glance
Here's how the five diagrams complement each other — each one answers a different question about your system:
| Diagram | Category | Core Question | Library System Example |
|---|---|---|---|
| Class Diagram | Structural | What are the classes and how do they relate? | Book, Member, Loan, Librarian — with inheritance, composition, associations |
| Use Case Diagram | Behavioral | Who are the users and what can they do? | Member borrows book, Librarian adds book, System sends overdue notice |
| Sequence Diagram | Behavioral | How do objects interact for a specific scenario? | Step-by-step message flow when a member borrows a book |
| Activity Diagram | Behavioral | What's the workflow with decisions and branches? | Book borrowing process — check availability, check member status, issue loan or reject |
| State Machine Diagram | Behavioral | What states can an object be in? | A Book: Available → Borrowed → Returned → Available (or Lost) |
Our Running Example — Library Management System
Throughout this entire section (S5), we'll model a Library Management System using all five diagram types. This lets you see the same system from five perspectives — just like the architectural blueprints for a house.
Here's the system we're modeling:
Core functionality:
- Members can search the catalog, borrow books, return books, and reserve books that are currently checked out
- Librarians can add new books, register new members, and manage overdue fines
- The system tracks which books are available, borrowed, or reserved
- Overdue books incur daily fines that members must pay before borrowing again
Key entities:
- Book — has a title, author, ISBN, and a status (Available, Borrowed, Reserved, Lost)
- Member — has a name, membership card, and a borrowing history
- Librarian — a specialized member who can manage inventory and members
- Loan — represents an active borrowing: which book, which member, borrow date, due date
- Reservation — a hold placed on a book by a member
- Fine — a penalty for overdue returns
By the end of S5, you'll have modeled this system with a class diagram (structure), use case diagram (actors and features), sequence diagram (borrow flow), activity diagram (reservation workflow), and state machine diagram (book lifecycle). Each diagram reveals something the others cannot — and together, they give you a complete picture.
You've already learned the OOP concepts that underpin these diagrams in S3 (Core Pillars) and S4 (Relationships). Now we put those concepts on paper.
UML in LLD Interviews
In LLD interviews, UML diagrams serve a specific purpose at each stage of the design process:
-
Requirements stage → Use Case Diagram. After clarifying requirements, sketch a use case diagram to confirm: "These are the actors and the features I'm designing for. Do you agree?"
-
Design stage → Class Diagram. As you identify key objects and relationships, draw a class diagram. This is often the most scrutinized diagram — interviewers evaluate your understanding of OOP relationships (inheritance vs composition), responsibility assignment, and design patterns.
-
Interaction detail → Sequence Diagram. For a specific scenario (e.g., "walk me through what happens when a user borrows a book"), draw a sequence diagram showing the method calls between objects.
-
Workflow clarification → Activity Diagram. If the problem involves complex decision logic (e.g., "how does the pricing engine work?"), an activity diagram shows the flow.
-
Object lifecycle → State Machine Diagram. If an object has multiple states with specific transitions (e.g., an order: Created → Confirmed → Shipped → Delivered), a state machine diagram communicates this.
You'll practice this exact interview workflow in S16 (The LLD Interview Framework).
Common Misconceptions About UML
Misconception 1: "UML is dead — no one uses it anymore"
Reality: The heavy, document-everything approach to UML (drawing 14 diagram types before writing any code) is dead — and rightfully so. But selective UML is alive and well. Class diagrams and sequence diagrams are drawn daily in design reviews, LLD interviews, architecture discussions, and pull request descriptions. You don't need to be a UML purist — you need to know enough to communicate designs.
Misconception 2: "UML means you're doing Waterfall"
Reality: UML is notation, not process. Agile teams sketch class diagrams on whiteboards during sprint planning. The key is just enough UML — sketch what you need, when you need it, and throw it away when it's outdated.
Misconception 3: "I should memorize every UML symbol"
Reality: You need about 20 symbols across 5 diagrams. Each tutorial in this section will teach you the specific notation for that diagram type. By the end, you'll know everything required for professional work and interviews.
Misconception 4: "UML diagrams must be exact and complete"
Reality: In practice — and especially in interviews — UML diagrams are sketches, not contracts. Include the key classes and relationships. Omit trivial getters/setters. The goal is to communicate design decisions, not to generate code from the diagram.
What's Coming Next
Over the next six tutorials, you'll master each diagram type:
-
Class Diagrams (next) — The foundation. You'll learn to represent classes, attributes, methods, and every relationship type (association, aggregation, composition, inheritance, dependency) with standard UML notation. We'll model the Library Management System's core entities.
-
Use Case Diagrams — Map out actors (Member, Librarian, System) and the actions they perform. Great for confirming scope with stakeholders or interviewers.
-
Sequence Diagrams — Trace the step-by-step interaction when a member borrows a book: which object calls which method, in what order, and what gets returned.
-
Activity Diagrams — Model the reservation workflow: check availability → place hold → notify when available → allow borrowing or expire.
-
State Machine Diagrams — Track a book through its lifecycle: Available → Borrowed → Overdue → Returned → Available (or Lost).
-
Practical Exercise — Given a fresh scenario, you'll practice reading existing UML and drawing your own diagrams from scratch.
Each of these builds on the OOP concepts from S3 (classes, inheritance, polymorphism) and S4 (association, aggregation, composition, dependency). If any of those feel shaky, revisit them before diving into UML — the diagrams are the visual representation of those exact concepts.
Key Takeaways
- UML is a standardized visual language for describing software design — it's the blueprint system for code, created by unifying competing notations in 1997
- You need five diagram types for LLD: Class (structure), Use Case (actors and features), Sequence (interactions over time), Activity (workflows), and State Machine (object lifecycle)
- Structural diagrams show what exists (classes, relationships); behavioral diagrams show what happens (interactions, workflows, state changes)
- Visual models solve the communication problem — a diagram communicates design intent in minutes; reading source code takes hours to reverse-engineer the same understanding
- In LLD interviews, you're expected to draw UML — especially class diagrams and sequence diagrams — to demonstrate your design thinking
- You don't need all 14 UML diagram types — the five we cover in S5 are sufficient for professional practice and interviews