Tracing LLM & Agent Calls
Introduction
This lesson opens Section 5 — Observability & Monitoring in Production. Everything you learned in Section 4 — read the traces, localize the broken stage, measure with evals — assumed one thing you may not actually have yet: you can see what your system did. In the debugging case study (L176 (Case Study: Debugging a Failing AI Feature)) the very first move was “instrument the feature to log full traces,” and the isolation test only worked because you could inspect each span. Tracing is how you get that visibility — and in production, it's not optional.
A modern AI feature is not a single API call. One user message can fan out into a planning LLM call, two or three tool calls, a retrieval, and a final synthesis call — each of which can be slow, expensive, or wrong. Logging “request → response, 1.9s” tells you nothing about which of those steps broke. A trace breaks the request into its spans and lays them on a timeline, so you can see exactly what happened, what it cost, how long each step took, and where it failed. Let's build that mental model precisely.
Trace, Span, and the Span Tree
Three terms carry the whole lesson:
- A span is one unit of work — a single LLM call, one tool invocation, one retrieval. It has a name, a start time and duration, and a bag of attributes (what model, how many tokens, the tool's arguments, an error).
- A trace is one complete request through your system — all the spans it produced, tied together by a shared
trace_id. - Spans nest: a span can have child spans, forming a tree. The root span is the whole operation; its children are the steps; their children are sub-steps.
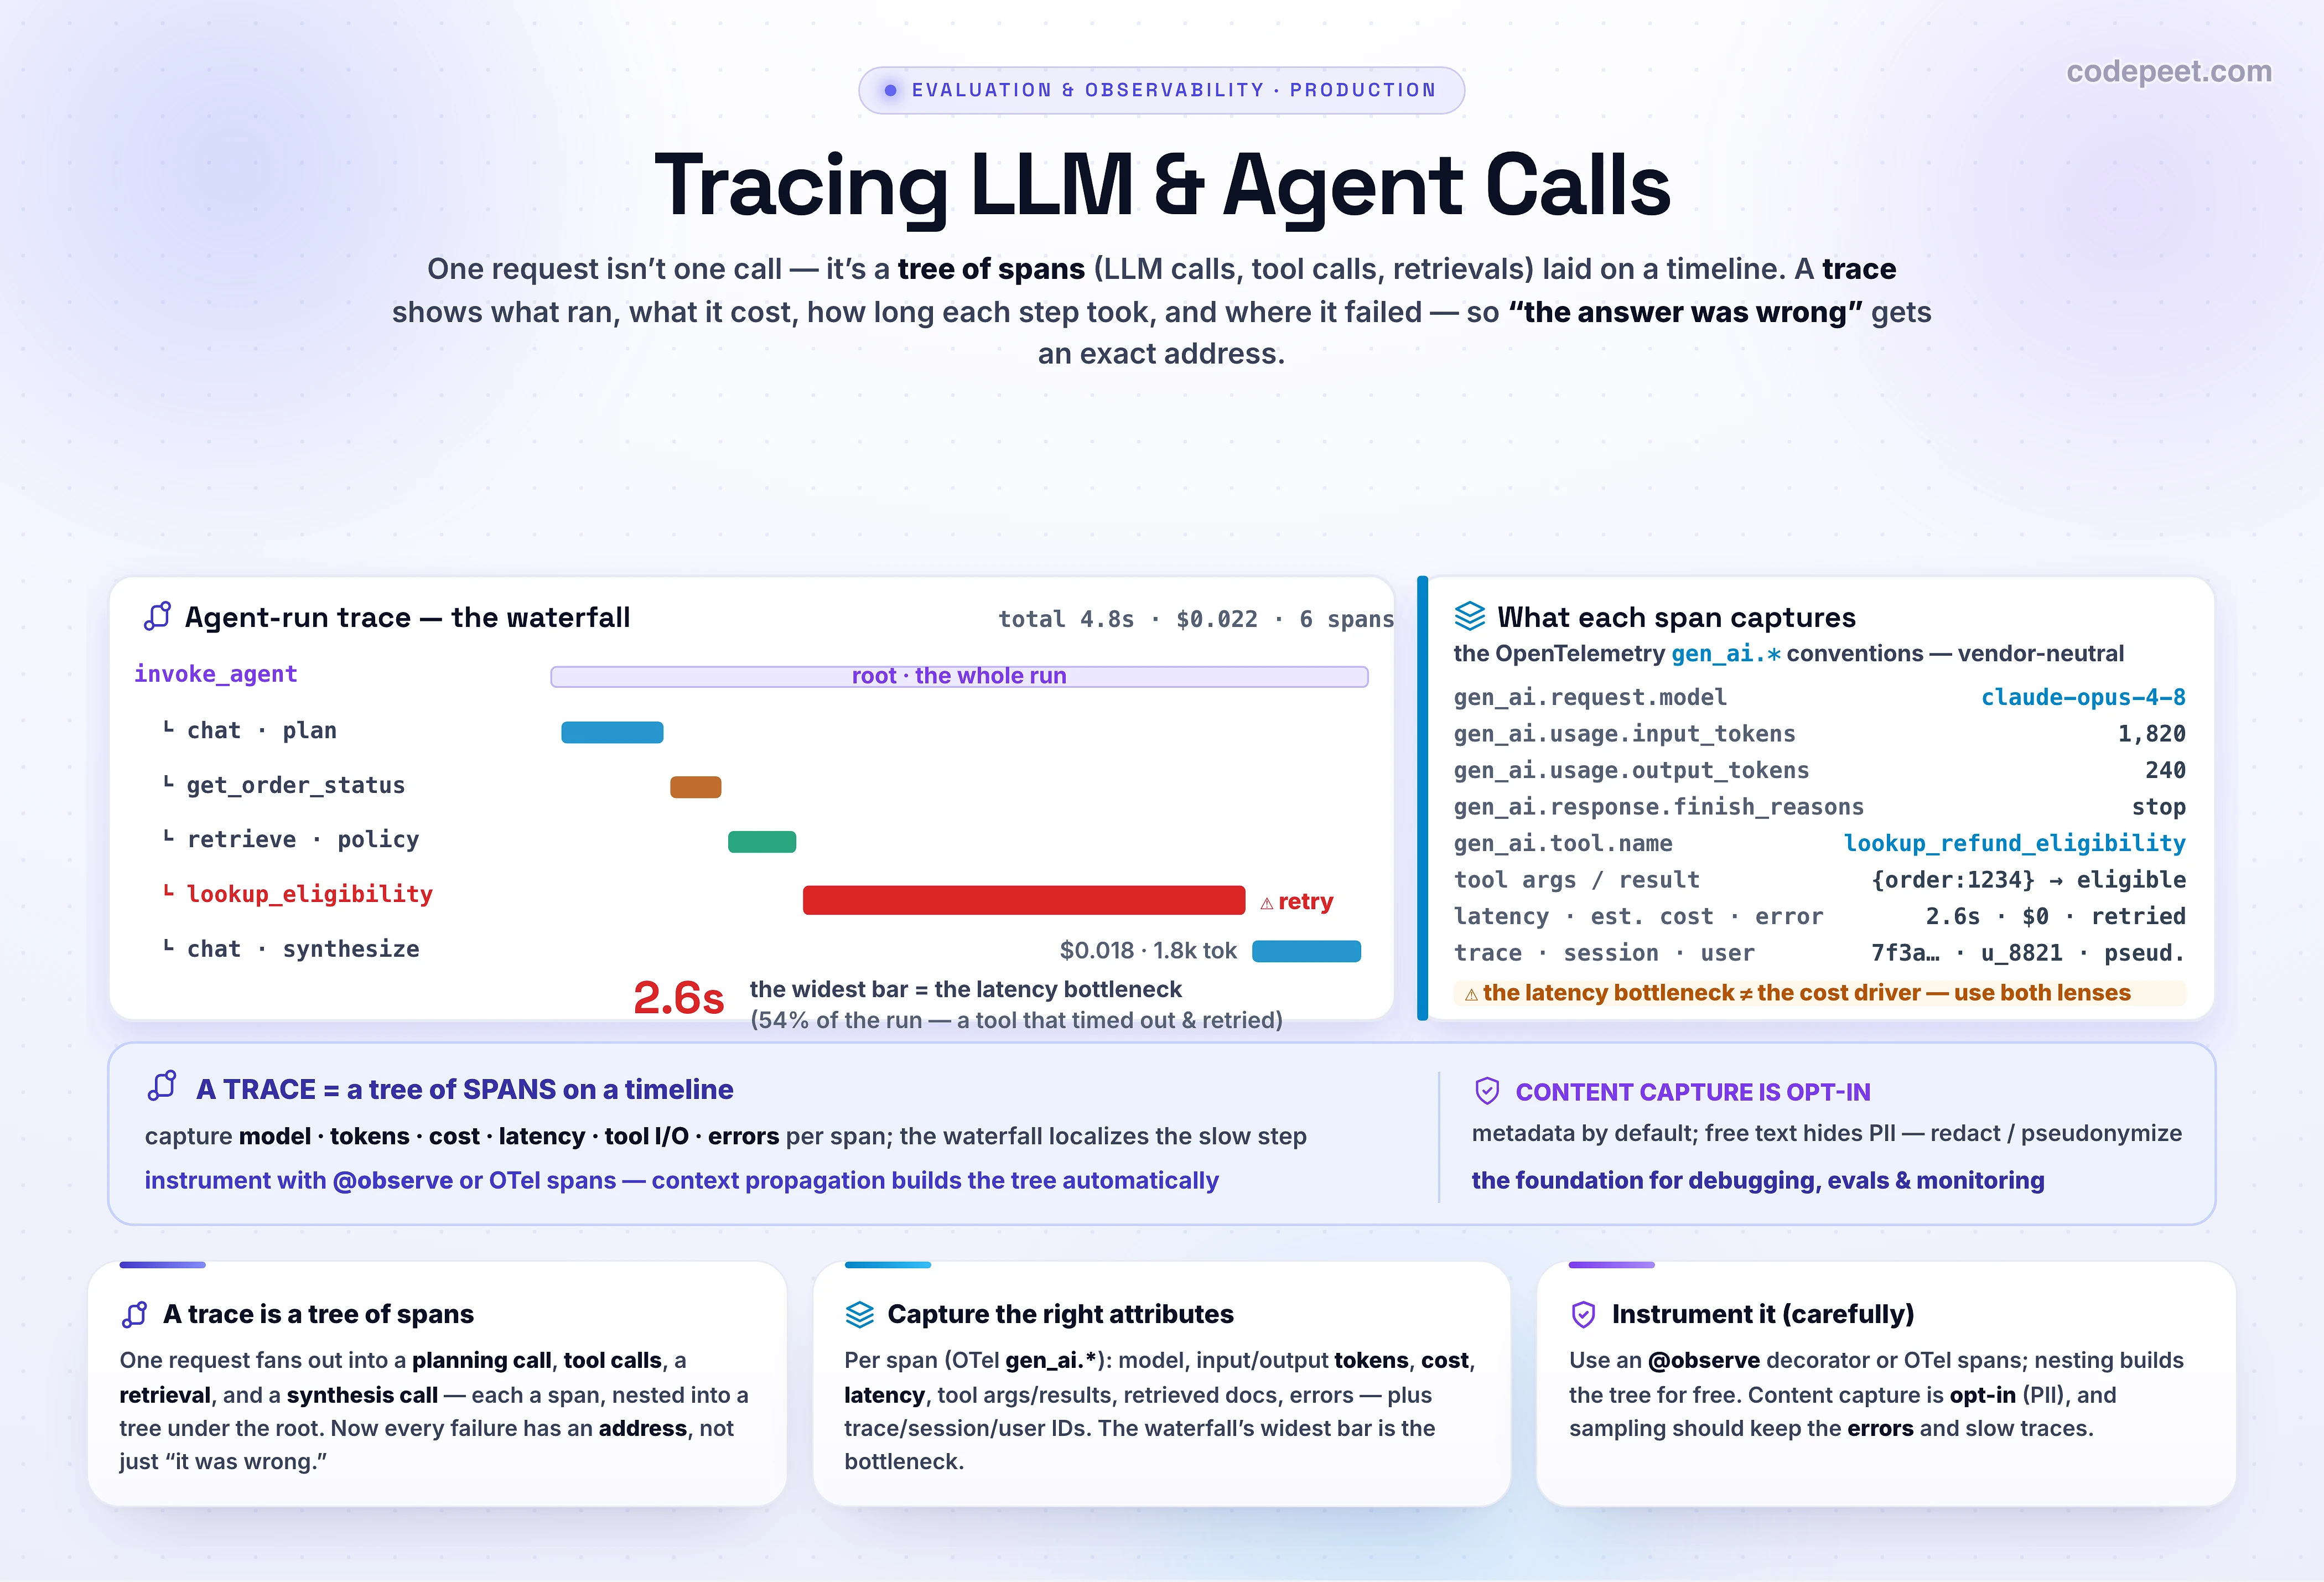
For an agent answering “Where's my order, and can I get a refund?”, the tree looks like this:
invoke_agent                         ← root span (the whole run)
├─ chat · plan                       ← LLM call: decide which tools to use
├─ execute_tool · get_order_status   ← tool call
├─ retrieve · refund_policy          ← vector search
├─ execute_tool · lookup_eligibility ← tool call
└─ chat · synthesize answer          ← LLM call: write the final answer
This structure is the point. “The answer was wrong” is one fact about the root; the tree tells you it was wrong because retrieve returned the wrong doc, or lookup_eligibility errored, or the final chat ignored the context. Without spans, every failure looks the same. With them, every failure has an address.
What to Capture per Span
A span is only as useful as its attributes. The industry has converged on a standard schema — the OpenTelemetry GenAI semantic conventions (a CNCF-backed standard, adopted by Datadog, Google Cloud, AWS, and the major LLM-observability tools). Standardizing matters: instrument once with gen_ai.* attributes and any OTLP-compatible backend can read your traces — no vendor lock-in.
For an LLM-call span (chat), capture:
gen_ai.request.model— e.g.claude-opus-4-8gen_ai.usage.input_tokensandgen_ai.usage.output_tokens— the token counts (your cost and a big chunk of your latency)gen_ai.response.finish_reasons—stop,tool_calls,max_tokens…- (opt-in)
gen_ai.input.messages/gen_ai.output.messages— the actual prompt and completion content
For a tool span (execute_tool): gen_ai.tool.name, the arguments the model produced, and the result (or error). For a retrieval span: the query and the retrieved documents with their scores. And on every span: latency, estimated cost, and any error. Tie the whole trace to a trace_id, a session.id (to follow a multi-turn conversation), and a pseudonymized user.id.
Why capture the exact inputs and outputs and not just a pass/fail? Because LLMs are non-deterministic — the same input can produce a different output next time, so you must store the exact output that occurred to reproduce and debug it.
The Waterfall: Localize the Bottleneck
Lay the spans on a timeline — each bar starting at the span's start time, its width proportional to its duration — and you get a waterfall. This single view is why tracing feels like turning on the lights:
- The slow step is literally the widest bar. “Slow steps jump out instantly because they are wider than their siblings.” You don't compute the bottleneck; you see it.
- It separates wall-clock from work. A wide bar with a retry inside (a tool that timed out and re-ran) looks completely different from a wide bar that's one long model generation.
- The latency bottleneck is often not the cost driver. A tool call can dominate the timeline (2.6 seconds, half the run) while costing nothing, and a fast final LLM call can dominate the bill because it stuffed 1,800 tokens of context into the prompt. Two different lenses on the same trace — and you need both.
This is the same localization skill from L176, now as a first-class production view: instead of guessing which step is slow or expensive, the waterfall points at it.
See It: The Trace Waterfall
Explore a real agent run. Click any span to see its OpenTelemetry gen_ai.* attributes — model, tokens, cost, latency, tool arguments and results. Flip the lens between ⏱ latency and 💲 cost and watch the bottleneck move — the slow tool is cheap; the fast final LLM call is expensive. Then toggle content capture to see the privacy trade-off. Two challenges: find the latency bottleneck and the cost driver.
The lesson in your hands: the structure does the work. The moment you can see the lookup_refund_eligibility bar is 2.6s with a retry inside, you know exactly where to look — and the moment you flip to the cost lens and the final chat lights up, you know exactly which span to trim. No guessing.
Instrumenting Your App
How do these spans get created? Two paths, and you'll usually use both.
The easy path — a decorator. Most LLM-observability SDKs give you an @observe (or @traceable) decorator. Decorate a function and it becomes a span; call another decorated function inside it and that becomes a child span. The tree builds itself from your call stack via context propagation — you write normal code and get a trace for free:
# The easy path: a decorator turns any function into a span; nested calls nest automatically.
from observe import observe      # @observe (Langfuse / Phoenix / Weave) · @traceable (LangSmith)

@observe()                        # this function = one span; its callees become CHILD spans
def answer(question: str):
    docs = retrieve(question)     # -> child "retrieve" span (auto-timed)
    return generate(question, docs)   # -> child "generate" (LLM) span

@observe()
def retrieve(q): ...              # captured for free: latency, inputs, outputs

@observe(as_type="generation")    # an LLM span: auto-captures model, tokens, cost, latency
def generate(q, docs):
    return client.messages.create(model="claude-opus-4-8", messages=build(q, docs))
# Auto-instrumentation gives you metadata (model, tokens, cost, latency) for free. CONTENT
# (the actual prompts & answers) is OPT-IN -> redact / pseudonymize PII before you store it.
The standard path — OpenTelemetry spans. For full control and vendor-neutral output, create spans explicitly with the OTel SDK and set the gen_ai.* attributes yourself. start_as_current_span automatically nests the new span under whatever span is currently active — which is exactly how the parent/child tree forms:
# A trace is a TREE of spans. With OpenTelemetry's GenAI conventions, ANY backend reads it.
from opentelemetry import trace
import json
tracer = trace.get_tracer("support.agent")

def handle(question, user_id, session_id):
    with tracer.start_as_current_span("invoke_agent") as root:   # ROOT span = the whole run
        root.set_attribute("gen_ai.operation.name", "invoke_agent")
        root.set_attribute("session.id", session_id)             # group a multi-turn conversation
        root.set_attribute("user.id", pseudonymize(user_id))     # pseudonymize PII

        with tracer.start_as_current_span("chat") as llm:        # child span: an LLM call
            r = client.messages.create(model="claude-opus-4-8", messages=msgs, tools=tools)
            llm.set_attribute("gen_ai.request.model", "claude-opus-4-8")
            llm.set_attribute("gen_ai.usage.input_tokens",  r.usage.input_tokens)
            llm.set_attribute("gen_ai.usage.output_tokens", r.usage.output_tokens)
            llm.set_attribute("gen_ai.response.finish_reasons", [r.stop_reason])

        with tracer.start_as_current_span("execute_tool") as t:  # child span: a tool call
            t.set_attribute("gen_ai.tool.name", "lookup_refund_eligibility")
            t.set_attribute("tool.arguments", json.dumps(args))
            result = run_tool(args)                              # the span auto-times the call
# start_as_current_span auto-nests under the CURRENT span -> the parent/child TREE builds itself.
Auto-instrumentation sits underneath both: libraries that wrap your LLM client and emit token/latency/cost/error spans with zero code changes. A common production setup is auto-instrumentation for the LLM calls plus a few @observe decorators on your own orchestration functions to give the tree meaningful names.
Production Concerns: PII, Sampling & IDs
Tracing in production has three sharp edges worth knowing before you turn it on:
- PII / content capture is opt-in for a reason. By default, capture metadata (model, tokens, latency, cost) and not content — “the payload most wanted for capture, the full prompt and completion, is exactly where PII hides.” When you do capture content (you'll want it for debugging and evals), redact or pseudonymize user IDs, emails, and account numbers, and scrub free-text fields. Privacy and debuggability are a deliberate balance, not an afterthought.
- IDs make traces useful. A
trace_idgroups one request's spans; asession.idstitches a multi-turn conversation together; auser.id(pseudonymized) lets you find every trace for a complaining user. Without them, you have spans but no way to navigate. - Sampling controls cost. Tracing every span of every request at high volume is expensive to store. Sample — but bias toward keeping the interesting traces (errors, slow requests, low-quality outputs) so you don't sample away the failures you most need to see.
LLM tracing also differs from classic microservice tracing in one way: because outputs are non-deterministic, you capture the exact input and output of each span, not just timing — you can't re-run to reproduce.
🧪 Try It Yourself
Instrument one real feature this week and look at its first trace:
- Pick a multi-step feature — anything with an LLM call plus a tool or a retrieval.
- Add tracing. Wrap your orchestration in
@observe(or OTel spans), or turn on your provider's auto-instrumentation. Name the root span for the feature. - Capture the essentials per span:
gen_ai.request.model, input/output tokens, latency, cost, tool name + arguments + result, retrieved docs, and any error. Addtrace_id,session.id, and a pseudonymizeduser.id. - Open the waterfall on a few real requests. Which span is the widest (latency bottleneck)? Which span has the most tokens (cost driver)? Are they the same span? (Usually not.)
- Find one failing trace and read its spans top-down to the first error — you just did L176's localization, now with production data.
You now have the raw material the rest of this section runs on — evals, monitoring, drift, and feedback all read traces.
Mental-Model Corrections
- “A trace is just a log line.” A trace is a tree of spans with structure, timing, and per-step attributes — not one flat “200 OK, 1.9s.” The structure is what lets you localize a failure.
- “Capture the input and the final output.” Capture every span — the planning call, each tool's args/results, the retrieved docs, the synthesis call. The bug is usually in a middle span you'd never see end-to-end.
- “The slow span is the expensive span.” Often not. A retrying tool dominates latency while costing nothing; a big-context LLM call dominates cost while being fast. Look at both lenses.
- “I'll log the prompts and answers by default.” Content is opt-in — free text hides PII. Capture metadata freely; redact/pseudonymize before storing content.
- “Tracing is the same as my APM/microservice tracing.” Same backbone (OTel spans), but LLM spans add
gen_ai.*attributes (model, tokens, finish reason) and must store the exact non-deterministic output to be reproducible. - “I'll add observability later.” Tracing is the prerequisite for everything else in production — debugging, evals, monitoring, drift, feedback. Instrument first; you can't improve what you can't see.
Key Takeaways
- A trace is a tree of spans; a span is one step (LLM call, tool, retrieval) with a name, duration, and attributes. The root is the whole request; children are its steps. “The answer was wrong” becomes “
retrievereturned the wrong doc.” - Capture per span (the OpenTelemetry
gen_ai.*conventions — a vendor-neutral standard):gen_ai.request.model, input/output tokens, finish_reasons, tool name/args/result, retrieved docs, plus latency, cost, and errors — tied to atrace_id,session.id, and pseudonymizeduser.id. - The waterfall localizes the bottleneck — the slow span is the widest bar — and the latency bottleneck is often not the cost driver. Two lenses on one trace.
- Instrument with a decorator (
@observe) or OTel spans; nesting/context-propagation builds the tree automatically. Auto-instrumentation captures metadata for free. - Content capture is opt-in (free text hides PII — redact/pseudonymize); sample toward keeping errors and slow/low-quality traces; store the exact non-deterministic output.
- Tracing is the foundation of the rest of this section — the raw material for evals, monitoring, drift detection, and feedback. Next: evaluating agents on their trajectories (L178 (Evaluating Agents: Trajectories, Tool Correctness & Step Efficiency)), read straight from these traces.