Observability Tools: LangSmith, Langfuse, Phoenix, Braintrust, Helicone
Introduction
You know how to trace (L177 (Tracing LLM & Agent Calls)) and how to evaluate — single calls, judges, and agent trajectories (L166–L178). This lesson answers the practical next question every team hits: where does all of that actually live? You don't hand-roll a span database, a trace viewer, an eval runner, a dataset store, and a prompt registry — you pick an LLM-observability platform that gives you those out of the box.
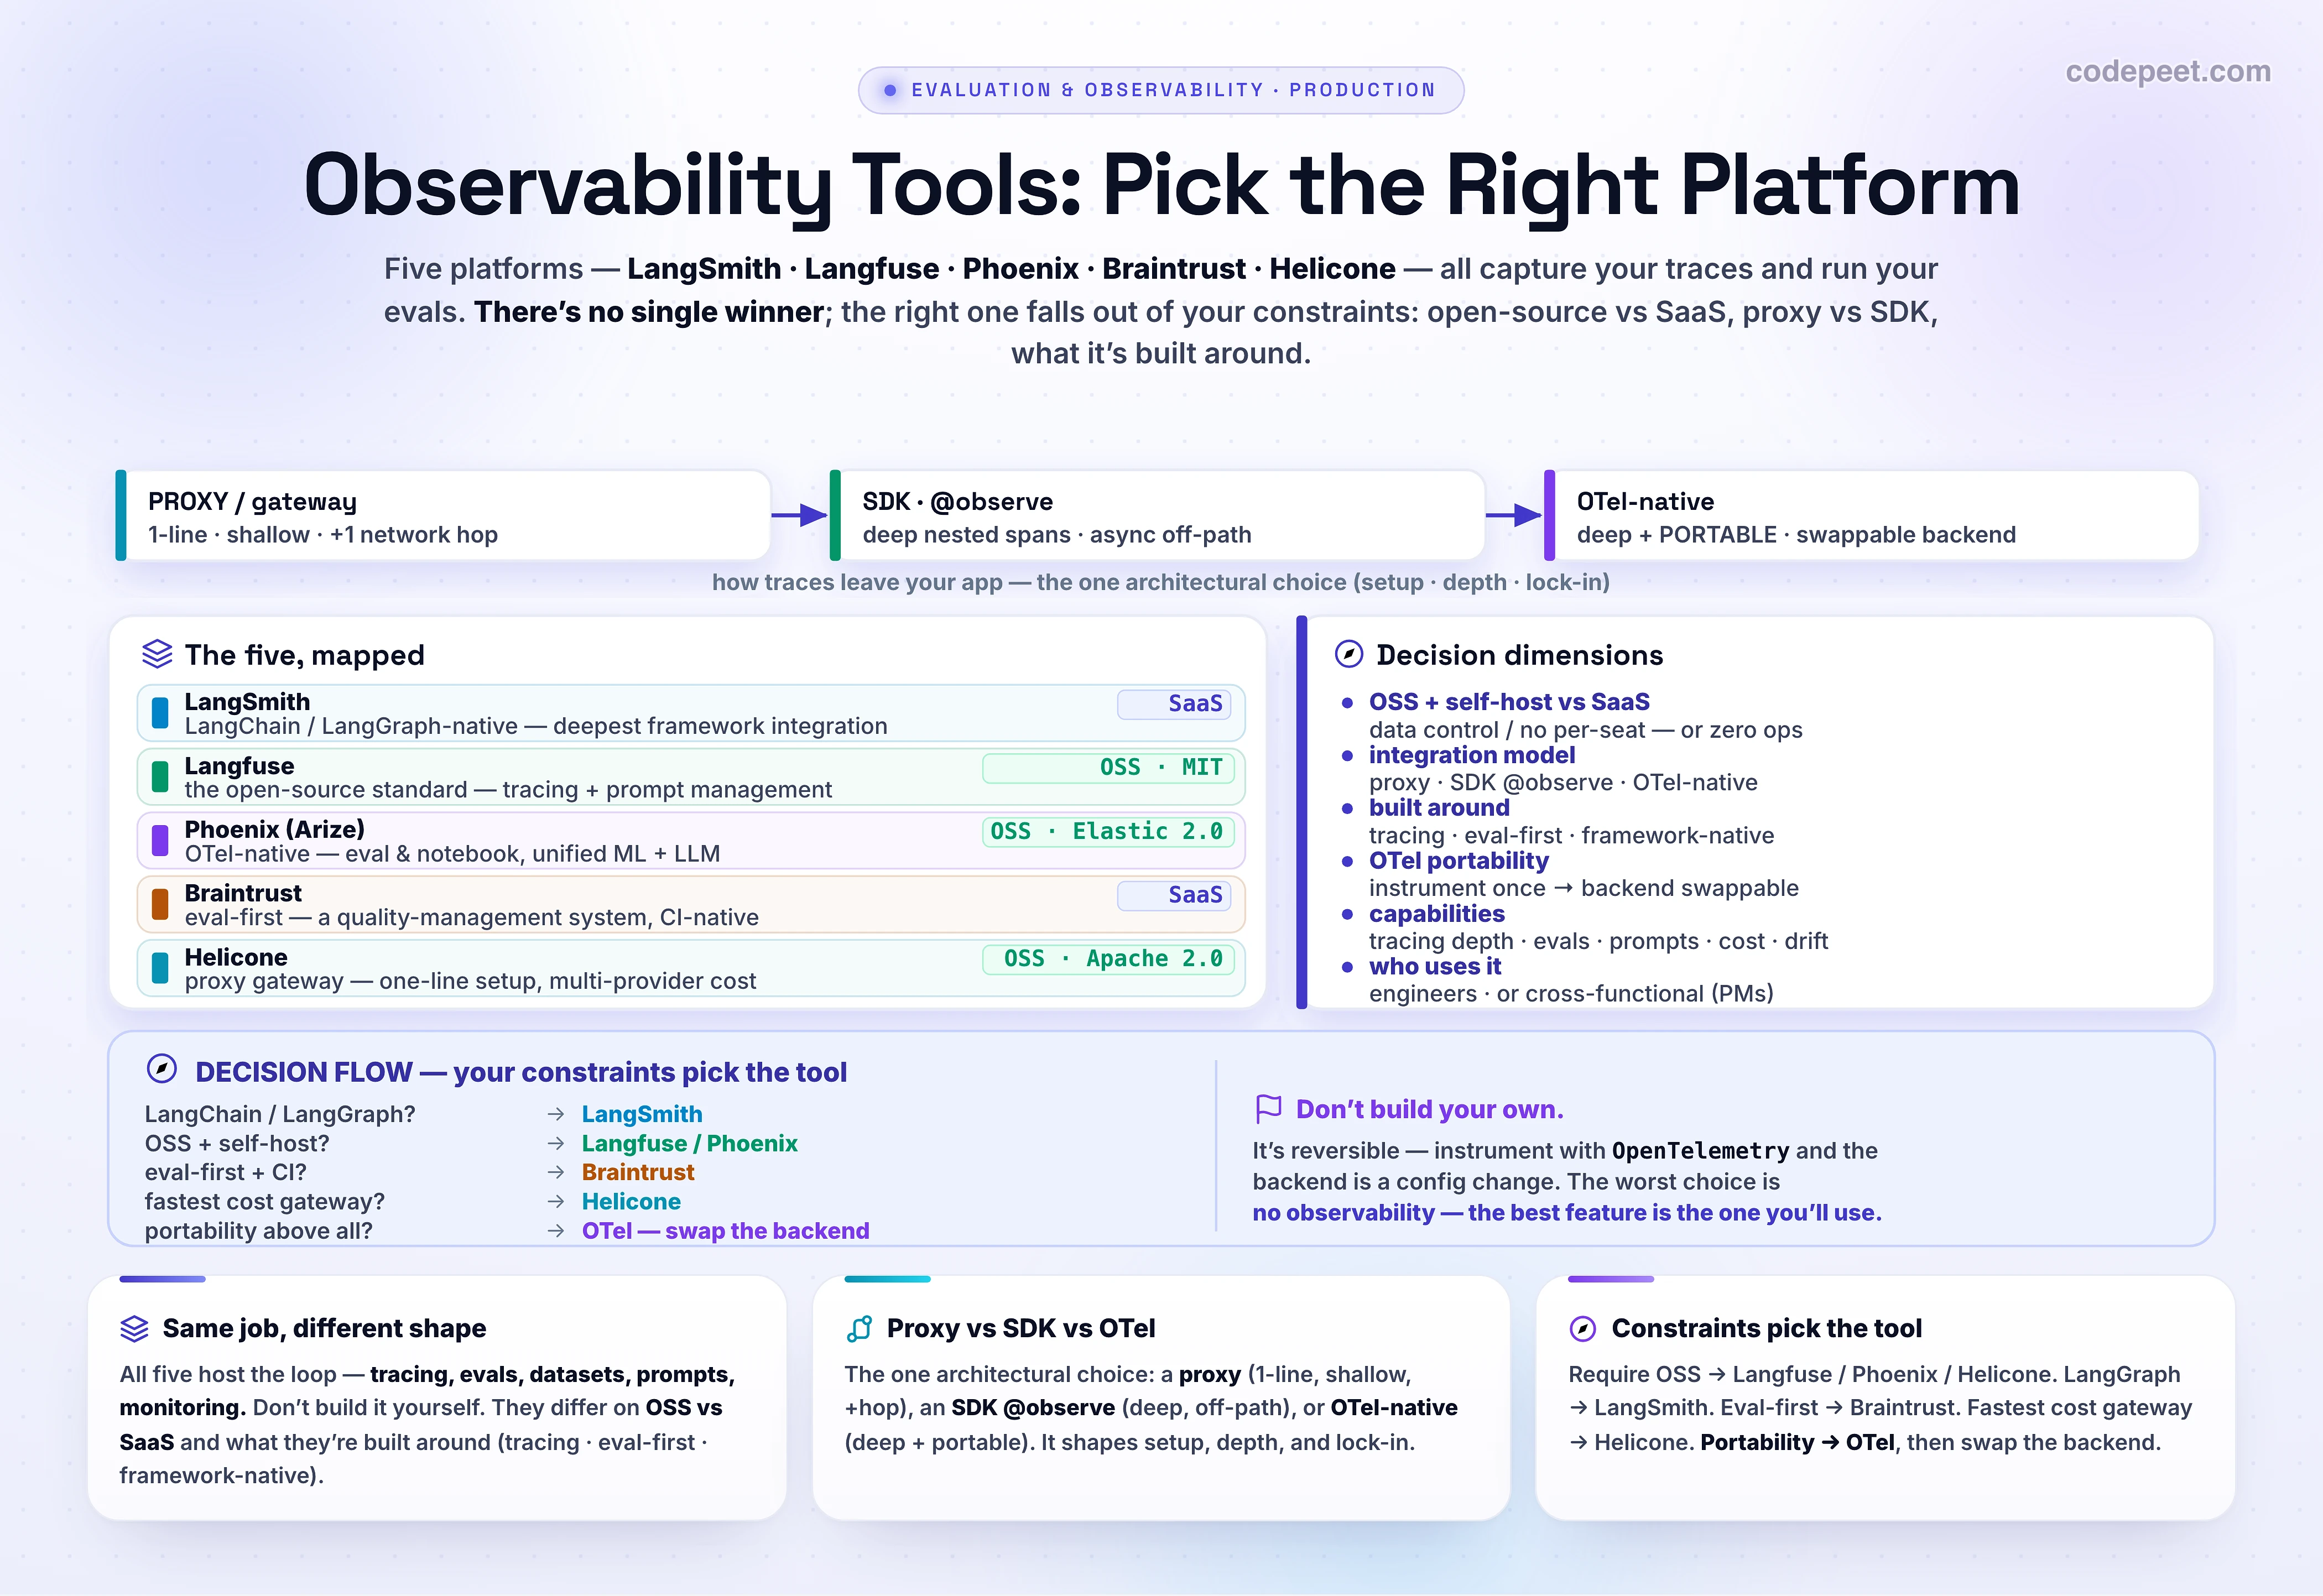
Five tools dominate the 2026 landscape: LangSmith, Langfuse, Phoenix (Arize), Braintrust, and Helicone. They all do the same core job — so the goal of this lesson is not a feature-by-feature scoreboard with a single winner (there isn't one). It's a decision framework: the handful of dimensions that actually matter, an honest one-liner on what each tool optimizes for, and a way to land on the right choice for your constraints. The tool you pick matters far less than whether you actually use it to read traces and run evals — but picking the one that fits your team makes that far more likely.
They All Do the Same Core Job
Before the differences, the commonality — because it's why “just pick one and start” beats “build it ourselves.” Every serious platform here gives you the same loop you've been learning, hosted:
- Tracing — capture the span tree of every request (L177): model, tokens, cost, latency, tool I/O, errors. A waterfall UI to inspect it.
- Evals / scoring — run code or LLM-as-judge evals (L160–L178) over traces and datasets; attach scores to spans.
- Datasets — collect production examples (and your failures — the L175 ratchet) into versioned test sets.
- Prompt management — store, version, and compare prompts as artifacts instead of hard-coding them.
- Monitoring — dashboards for cost, latency, volume, and quality over time; alerts.
Building even a passable version of this is months of work you don't need to spend. So the real question isn't “trace viewer or not?” — it's which hosted version fits how your team works. That's what the rest of the lesson decides.
The One Architectural Choice: Proxy vs SDK vs OTel
If you remember one distinction from this lesson, make it how traces get out of your app — it shapes setup time, depth, and lock-in more than any feature list:
- Proxy / gateway (Helicone) — you change your API base URL to route calls through the vendor. Zero code, instant, and you get gateway extras (caching, rate-limits, multi-provider cost control). The trade-offs: it adds one network hop on the request path, and it only sees the API call — not your agent's internal tool/retrieval steps.
- SDK decorator (Langfuse, Braintrust, LangSmith) — you wrap functions with
@observe/@traceable. You get deep, nested spans (agent → tool → retrieval), and the SDK batches and flushes asynchronously, off the user-facing request path (no added latency). Slightly more setup; far more depth. - OpenTelemetry-native (Phoenix / OpenInference) — you emit standard
gen_ai.*spans (L177) and point them at any OTLP backend. Deep and portable — the backend becomes swappable, which is the direction the market is moving.
Here are all three, in code:
# The ONE architectural choice: how do traces get OUT of your app? Three models.

# 1) PROXY / GATEWAY (e.g. Helicone) — change the base URL. Zero code, instant, but it adds a
#    network hop and only sees the API call (not your agent's internal steps).
client = Anthropic(base_url="https://anthropic.helicone.ai", default_headers={"Helicone-Auth": KEY})
client.messages.create(model="claude-opus-4-8", messages=msgs)   # ...now logged by the gateway

# 2) SDK DECORATOR (e.g. Langfuse / Braintrust / LangSmith) — wrap your code. DEEP nested spans
#    (agent -> tool -> retrieval), and the SDK flushes async, OFF the user's request path.
from langfuse.decorators import observe
@observe()                                # this function becomes a span; callees nest under it
def answer(q):
    return Anthropic().messages.create(model="claude-opus-4-8", messages=build(q))

# 3) OTEL-NATIVE (e.g. Phoenix / OpenInference) — emit standard gen_ai.* spans; point them at
#    ANY OTLP backend. Most portable; the backend becomes swappable.
from openinference.instrumentation.anthropic import AnthropicInstrumentor
AnthropicInstrumentor().instrument()      # auto-captures every Claude call as an OTel span
Most teams end up mixing: a proxy for quick multi-provider cost control, plus an SDK or OTel instrumentation for the deep agent traces. But the default that ages best is instrument with OpenTelemetry — then switching platforms later is a config change, not a rewrite.
The Decision Dimensions
Beyond the integration model, six dimensions decide the fit. Score your situation on each:
- Open-source + self-host vs managed SaaS. Need data residency, no per-seat licensing, or full control? → open-source (Langfuse, Phoenix, Helicone all self-host). Want zero ops and a polished hosted product? → SaaS (LangSmith, Braintrust).
- What it's built around. Tracing-first (Langfuse, Phoenix), eval-first (Braintrust — evaluation is the product, tracing supports it), or framework-native (LangSmith, built for LangChain/LangGraph with node-by-node agent graphs).
- OpenTelemetry alignment. OTel-native (Phoenix/OpenInference) maximizes portability and avoids lock-in; others increasingly ingest OTel.
- Evaluation maturity. Is evaluation core with research-backed metrics (Braintrust), or a backbone you wire your own judges into (Langfuse)? Built-in metric depth varies a lot.
- Capabilities you need: deep agent tracing, datasets, prompt management, cost tracking, drift/embedding analysis (Arize's strength for ML+LLM).
- Who uses it. Engineers only, or cross-functional (PMs and domain experts annotating without engineering gatekeeping — Braintrust and LangSmith lean here; Phoenix's UX is more technical-operator).
No tool wins on all six. Your constraints pick the tool — which is exactly what the widget makes concrete.
The Five, Mapped
Honest one-liners — what each is genuinely best at, and the catch:
- LangSmith — the LangChain/LangGraph platform. The deepest framework integration in the field: node-by-node state diffs, full agent-execution graphs. Full platform (tracing, evals, datasets, Prompt Hub, playground). Proprietary, priced on seats + traces. Best for: teams committed to LangChain/LangGraph. Catch: coupling to that stack; not open-source.
- Langfuse — the open-source standard. MIT-licensed, self-hostable, unlimited users, strong prompt management and a flexible eval backbone (you attach scores / wire your own judges). Best for: OSS + data control + prompt management. Catch: fewer built-in eval metrics; the self-host stack is heavy (Postgres + ClickHouse + Redis + S3).
- Phoenix (Arize) — OTel-native and open-source (Elastic 2.0, OpenInference). Lightest to self-host; great for eval/notebook workflows; Arize AX adds enterprise drift/embedding analysis and unified ML + LLM views. Best for: portability and ML+LLM shops. Catch: built-in eval depth is thinner; UX is technical-operator-oriented.
- Braintrust — eval-first. A quality-management system: observability and evaluation in one connected workflow, trace-to-test, CI/CD-native, collaboration-friendly. Best for: eval-first regression workflows wired into development. Catch: proprietary; tracing is built around the eval model.
- Helicone — the proxy/gateway. The simplest install (one line), open-source (Apache 2.0), with multi-provider cost, caching, and rate-limit control. Best for: fast time-to-value and spend visibility across providers. Catch: request-level depth (not deep agent graphs) and a network hop — teams usually pair it with deeper tooling.
See It: Match the Tool
Stop reading marketing pages — state your constraints and let the fit fall out. Set whether open-source/self-host is required, your #1 need, your framework, and who uses it — and watch the five tools re-rank live, with the reasons and a feature matrix where the cells that match your top need glow. Flip the inputs and feel how the “best” tool changes with the constraints — because it does.
The point of the widget isn't to crown a winner — it's to show that the winner is a function of your inputs. Require open-source and the SaaS tools drop out. Optimize for a multi-provider cost gateway and Helicone jumps to the top. Commit to LangGraph and LangSmith wins by a mile. Same five tools, different constraints, different answer.
How to Choose (and Why It's Reversible)
A quick decision flow that resolves most teams:
- Committed to LangChain / LangGraph? → LangSmith. The framework integration pays for the lock-in.
- Need open-source + self-host (data control, no per-seat cost)? → Langfuse (prompt management, unlimited users) or Phoenix (OTel-native, ML+LLM).
- Evaluation is the center of gravity, wired into CI, with non-engineers in the loop? → Braintrust.
- You just want multi-provider cost/latency visibility today with one line? → Helicone (and add depth later).
- Portability above all? → instrument with OpenTelemetry / OpenInference and treat the backend as swappable (Phoenix assumes this; the market is heading there).
And the liberating part: this decision is reversible. If you instrument with OTel, moving from one backend to another is a config change. Don't agonize — the worst choice is analysis paralysis that leaves you with no observability at all. Start with the one that fits your constraints, get traces flowing, run your first eval, and iterate. The best platform is the one your team will actually open every day.
# Vendor-neutral path: instrument with OpenTelemetry ONCE, then choose the backend with an
# env var. Switching tools later is a config change, not a rewrite — this is how you avoid
# lock-in (the direction the whole market is moving).
import os
from opentelemetry.sdk.trace.export import OTLPSpanExporter   # OTLP works with Phoenix, Langfuse,
exporter = OTLPSpanExporter(endpoint=os.environ["OTLP_ENDPOINT"])  # Datadog, Honeycomb, ...

# Whatever the backend, the workflow is the same loop you already know:
#   capture TRACES (L177)  ->  attach SCORES / run EVALS (L166-178)  ->  build DATASETS from
#   production failures (the ratchet, L175)  ->  manage PROMPTS as versioned artifacts.
# The tool is WHERE that loop lives. The most important feature is the one you'll actually use.
🧪 Try It Yourself
Pick a tool and ship a trace this week — the whole point is to start:
- State your hard constraints. Is self-hosting / open-source a must (compliance, data residency)? That alone narrows you to Langfuse / Phoenix / Helicone.
- Name your #1 need. Deep agent tracing? Eval-first regression? Prompt management? Multi-provider cost? Use the widget to rank the survivors.
- Instrument the fast way first. If you want a trace in 5 minutes, route through Helicone's proxy or drop in one
@observedecorator. Prefer OTel/OpenInference if you care about portability. - Capture one real trace and open the waterfall (L177). Then attach one score to it (a code check or a judge from L173).
- Make one dataset from a handful of production failures (L175) and run your eval against it in the tool.
When you've done that, you have a live observability loop — and you can always swap the backend later if you outgrow it. Movement beats the perfect choice.
Mental-Model Corrections
- “Which tool is best?” Wrong question — there's no single winner. The right tool falls out of your constraints (OSS vs SaaS, integration model, what it's built around).
- “We'll build our own trace viewer + eval runner.” Months of undifferentiated work. Don't build your own — these platforms hand you tracing, evals, datasets, prompts, and dashboards on day one.
- “A proxy is all I need.” A proxy (Helicone) is fast and shallow — great for API-level cost, but it can't see your agent's internal steps. For deep traces use an SDK/OTel; many teams run both.
- “Picking a tool locks me in forever.” Not if you instrument with OpenTelemetry — the backend becomes a config change. Lock-in is a choice, mostly avoidable.
- “Open-source means free and easy.” Free to license, not to run — self-hosting Langfuse means operating Postgres + ClickHouse + Redis + S3. Factor in ops cost.
- “The tool with the most features wins.” The tool you'll actually use wins. A simpler platform your team opens daily beats a powerful one nobody logs into.
Key Takeaways
- Don't build your own — pick a platform that hosts the loop: tracing (L177), evals/scoring (L166–L178), datasets (L175), prompt management, and monitoring.
- The one architectural choice is the integration model: proxy (Helicone — 1-line, shallow, +1 hop), SDK decorator (Langfuse/Braintrust/LangSmith — deep nested spans, async off-path), or OTel-native (Phoenix/OpenInference — deep + portable).
- The five, mapped: LangSmith (LangChain-native, proprietary) · Langfuse (open-source standard, prompts) · Phoenix (OTel-native, OSS, ML+LLM) · Braintrust (eval-first, CI-native) · Helicone (proxy gateway, fastest setup, cost control).
- Choose by your constraints: OSS+self-host vs SaaS; what it's built around (tracing/eval/framework); OTel portability; eval maturity; team (eng vs cross-functional). No tool wins on every axis.
- It's reversible: instrument with OpenTelemetry and the backend is swappable. The worst choice is no observability — start, get traces flowing, run an eval, iterate.
- Next: with traces flowing, run evals on live production traffic — online evals & guardrail metrics (L180 (Online Evals & Guardrail Metrics)).