Inference Performance Metrics (TTFT, TPOT, Throughput)
Introduction
Welcome to Production AI Engineering. For five containers you learned to build the intelligence — transformers and decoding (L7, L27), RAG, agents, evaluation, and fine-tuning (L206). This container is about everything that happens after the model is good: making it fast, cheap, and reliable under real traffic. And the very first thing — before any optimization — is learning to measure speed correctly.
Here's the trap this whole lesson exists to fix:
"The model is slow" is not a metric. A generation request has two completely different clocks — the wait before the first word appears, and the pace of every word after. They have different causes and different fixes, and a single "latency" number blurs them into something you can't act on.
Get this vocabulary right and the rest of the section (KV cache, batching, serving) is just moving these numbers. Get it wrong and you'll optimize the thing your users don't feel.
In this lesson:
- Why one number lies — a request has a prefill phase and a decode phase, and they behave oppositely
- TTFT (time to first token), TPOT/ITL (time per output token), and E2E latency — with the formula that ties them together
- Throughput (what you actually pay for) and the latency-vs-throughput trade-off
- How to measure all of it from a real streaming response (Claude + OpenAI)
- Percentiles (why the average lies) and goodput — the 2026 metric that matches what users feel
Scope: this lesson is the vocabulary and measurement. The mechanisms that move these numbers come next — the KV cache (L208), continuous batching (L209), speculative decoding (L210), serving with vLLM/TGI (L211), and streaming for perceived latency (L212). Dollar cost is its own lesson — Token Economics (L213). We'll name those mechanisms here, but go deep there.
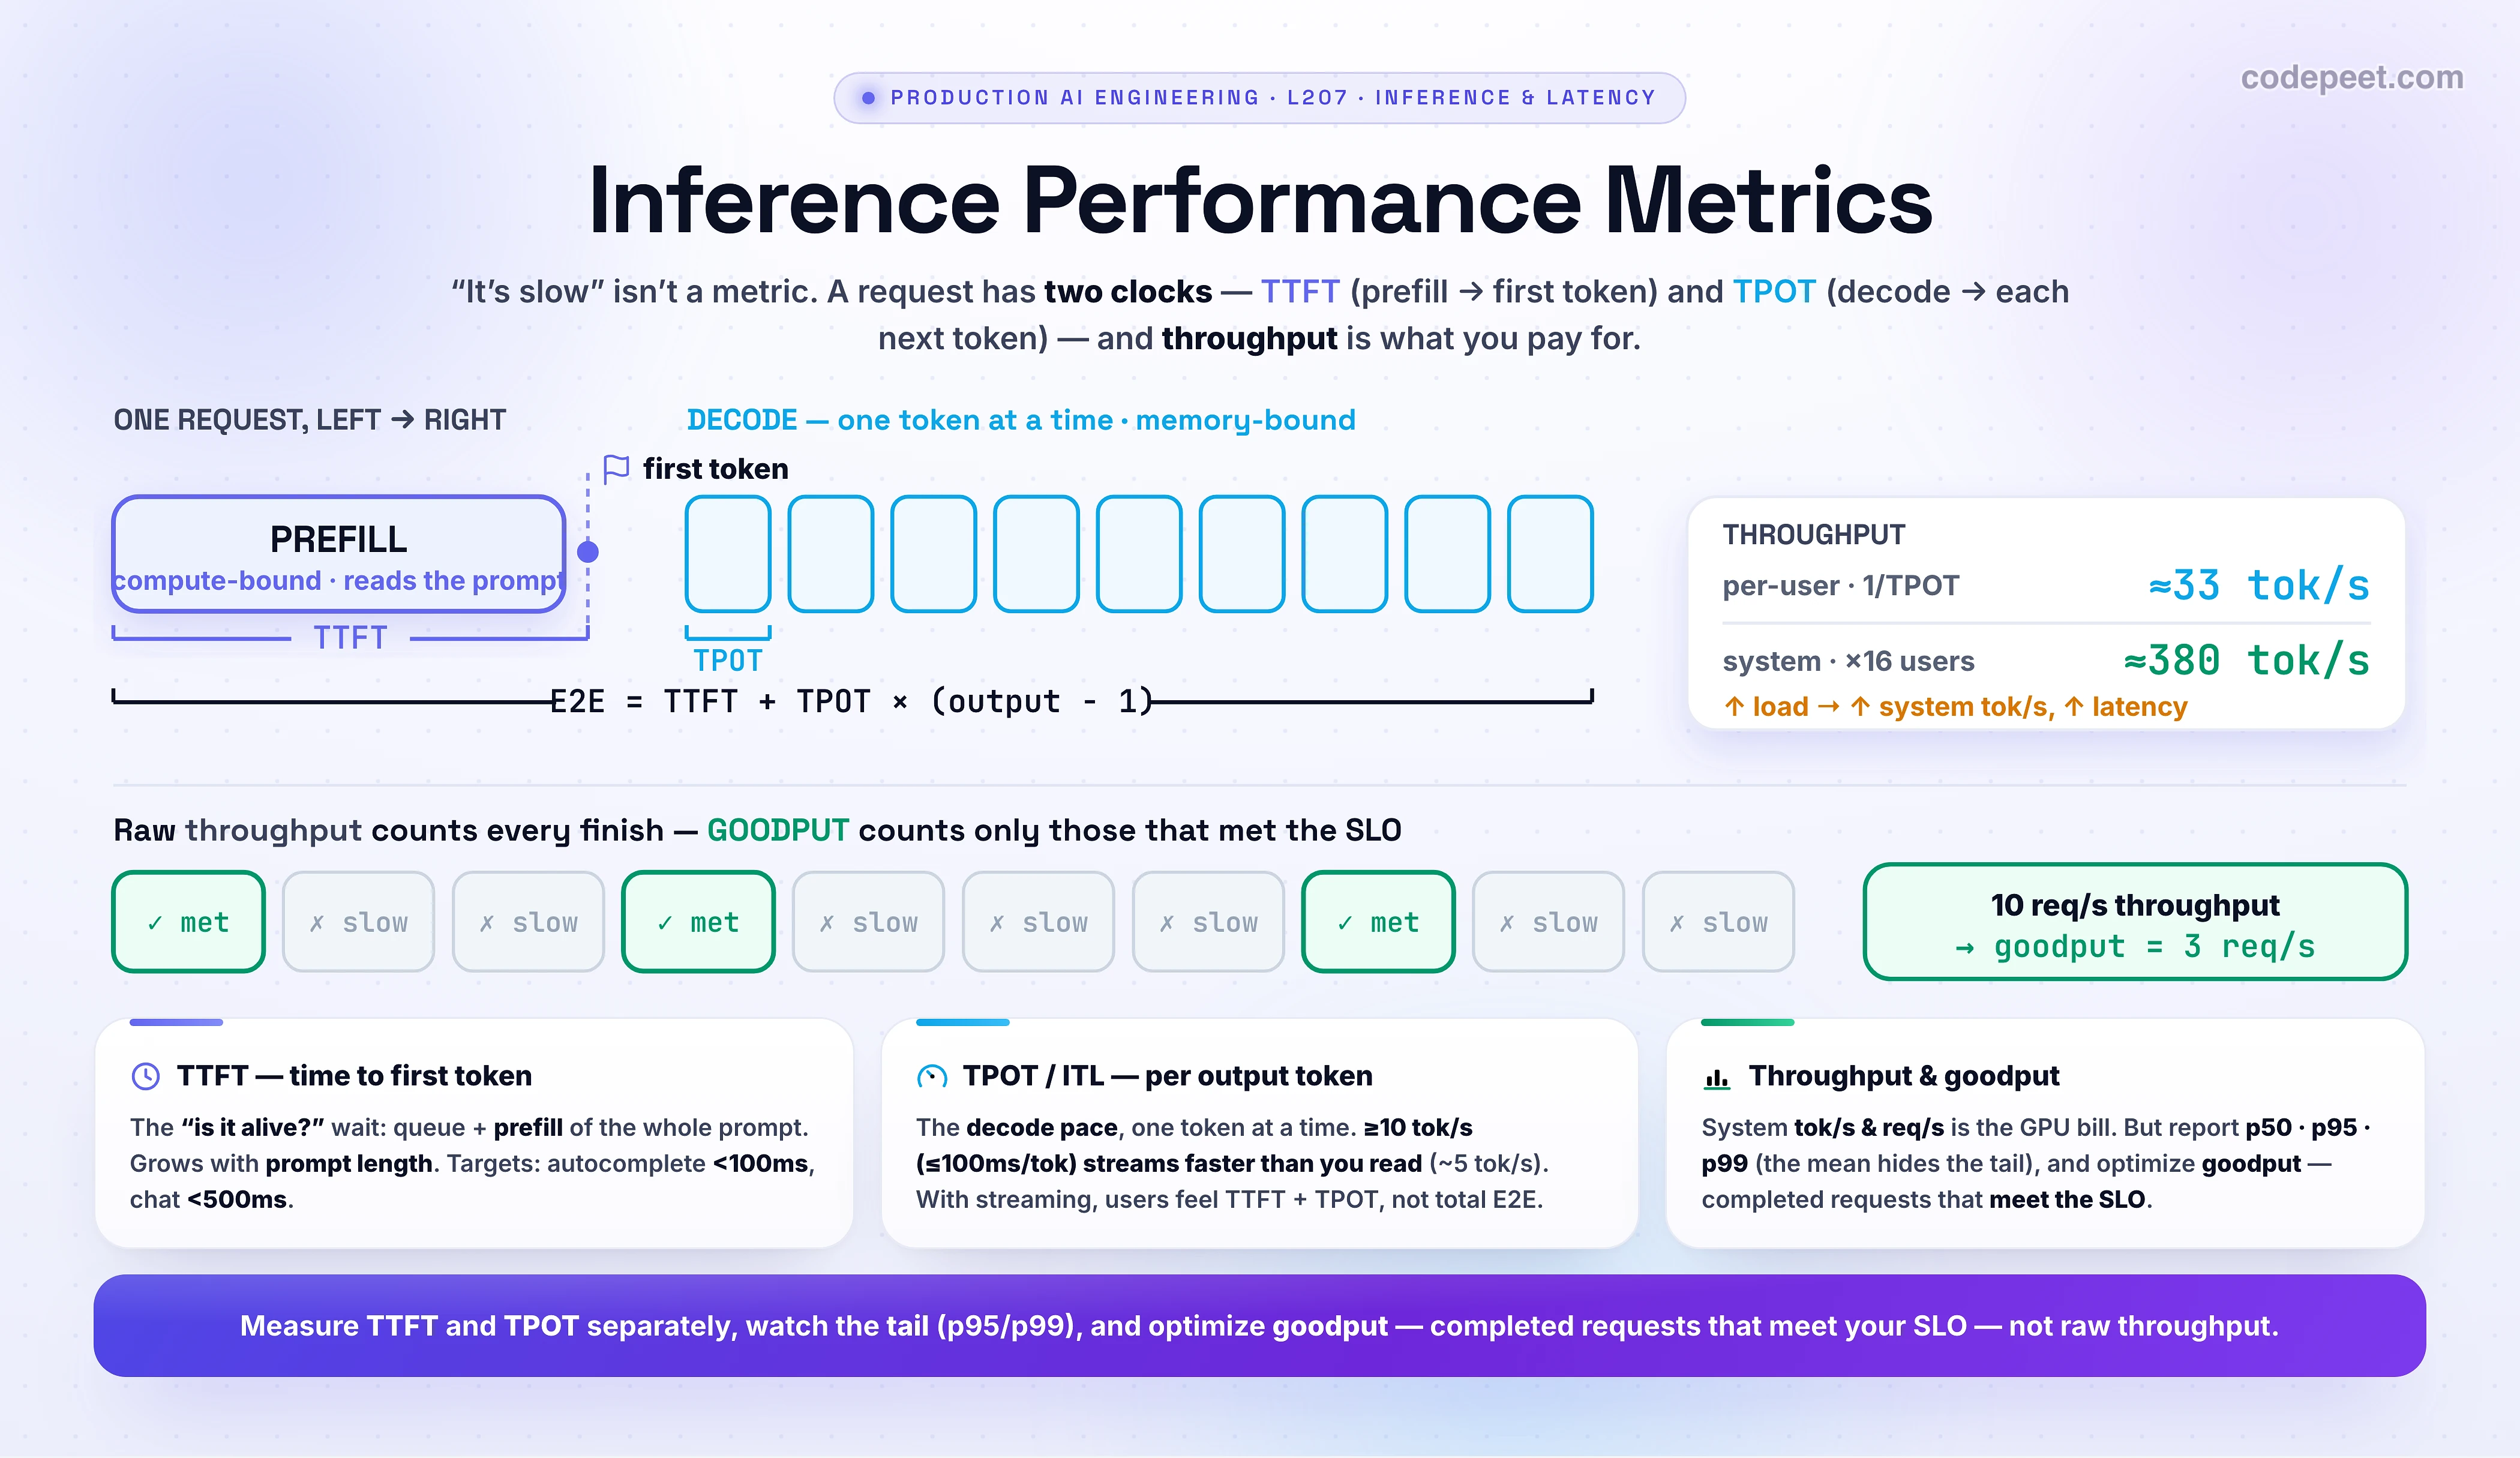
"It's Slow" Isn't a Metric — A Request Has Two Clocks
Recall from the foundations that an LLM is autoregressive: it generates one token at a time, each token conditioned on everything before it (L7, L27). That single fact splits every request into two phases with opposite performance characteristics — and that's why you need two metrics, not one.
Phase 1 — Prefill. Before it can write anything, the model must read your entire prompt and build up its internal state. It processes all the prompt tokens in parallel, in one big pass. This is a dense matrix-times-matrix workload that saturates the GPU's math units — it is compute-bound. Prefill ends the moment the first output token pops out. The time from "send" to that first token is TTFT.
Phase 2 — Decode. Now the model generates the rest, one token per step, each step feeding the previous token back in. Each step is a skinny matrix-times-vector that barely uses the GPU's math units — but it must stream the entire model's weights (and the growing KV cache) out of memory to produce one token. So decode is memory-bandwidth-bound: limited by how fast you can move bytes, not how fast you can multiply. Typical GPU compute utilization in decode is only ~20-40%. The pace of these steps is TPOT.
| Prefill (→ TTFT) | Decode (→ TPOT) | |
|---|---|---|
| Processes | the whole prompt, in parallel | one output token at a time |
| Compute shape | matrix x matrix (dense) | matrix x vector (skinny) |
| Bottleneck | compute-bound (GPU math) | memory-bandwidth-bound (moving weights) |
| Grows with | prompt length | output length |
| You feel it as | the wait before the 1st word | the pace of every word after |
This is the mental model for the whole section. Why decode is memory-bound — and how the KV cache and batching change it — is L208-L209. Here, just hold onto the split: two phases, two metrics.
TTFT — Time to First Token
Time To First Token (TTFT) is the time from when the request is sent to when the first output token arrives. It's the "is it alive?" metric — the silence the user stares at before anything happens.
What's inside TTFT:
- Queue / scheduling delay — how long the request waits before the server even starts it (this grows under load).
- Prefill — processing the entire prompt to produce the first token (the compute-bound phase above).
- Network — round-trip to the API and back.
The key driver you control is prompt length: TTFT grows with the number of input tokens, because prefill has more to chew through. A 200-token prompt might prefill in tens of milliseconds; a 100K-token document is a noticeably longer wait before the model says anything. This is exactly why stuffing a giant context has a latency cost, not just a token-bill cost.
Why it matters most for interactive UX: TTFT is the difference between an app that feels instant and one that feels broken. Rough industry targets:
| Use case | TTFT target | Why |
|---|---|---|
| Code autocomplete | < ~100 ms | It has to appear as you type, or it's useless |
| Voice / conversational | < ~300 ms | Below the threshold where a pause feels awkward |
| Chatbot reply | < ~500 ms | Feels responsive; the user knows it heard them |
| Batch summarization / report | seconds is fine | Nobody is watching the first token |
Notice the target depends entirely on the experience, not the model. That's the theme of this whole lesson: a metric only means something against an SLO for a specific workload.
TPOT / ITL — Time Per Output Token
Once the first token is out, Time Per Output Token (TPOT) is the average time to produce each subsequent token — the decode pace. It's the "how fast does it type?" metric. You'll also see it called Inter-Token Latency (ITL); the two are used almost interchangeably (a subtle difference below).
It's defined by excluding the first token (that was TTFT) and averaging over the rest:
TPOT = (E2E latency − TTFT) / (output tokens − 1)
So if a response of 201 tokens took 6.0 s end-to-end with a TTFT of 0.2 s, then TPOT = (6.0 − 0.2) / 200 = 29 ms/token ≈ 34 tokens/second.
How fast is fast enough? Anchor it to human reading speed:
- People read ~3-5 tokens/second (200-300 words/min).
- So ~10 tokens/second (≈100 ms/token) already streams faster than you can read — it feels smooth.
- Below ~8 tokens/second it starts to feel like it's being typed out slowly and you wait on it.
- At 50+ tokens/second it's effectively instant, and the bottleneck the user perceives shifts back to TTFT.
This is why streaming is so powerful: as long as TPOT beats reading speed, the user reads continuously and the total generation time barely matters. (Streaming for perceived latency is L212; latency as a product feature is L224.)
The ITL-vs-TPOT subtlety (so you're not confused by benchmark tools): ITL is the actual measured gap between two consecutive tokens; TPOT is the average of those gaps. For a single request they're the same number. Across many requests, tools compute ITL token-weighted (every token counts equally) and TPOT request-weighted (every request counts equally) — so on mixed-length traffic they can differ slightly. For everyday use, treat them as the same thing: the decode pace.
End-to-End Latency — The Formula That Ties Them Together
End-to-end (E2E) latency is the total wall-clock time from request to the last token — the complete answer in hand. It's just the two clocks added up:
E2E = TTFT + TPOT × (output tokens − 1)
This little formula is the most useful thing in the lesson, because it tells you where your time goes and therefore what to optimize. Two requests with the same 3-second E2E can be completely different problems:
| Request | Prompt | Output | TTFT | TPOT | E2E | Bottleneck |
|---|---|---|---|---|---|---|
| Summarize a long doc | 16,000 tok | 200 tok | ~0.9 s | 30 ms | ~6.9 s | Prefill — long wait, then quick |
| Write a long report | 800 tok | 1,500 tok | ~0.12 s | 30 ms | ~45 s | Decode — instant start, long tail |
| Autocomplete | 400 tok | 12 tok | ~0.10 s | 30 ms | ~0.4 s | TTFT — the start is the request |
The summary is prefill-dominated — to make it feel faster you attack TTFT (shorter context, prompt caching, L208). The report is decode-dominated — E2E is long no matter what, so you lean on streaming so the user reads as it writes, and on raising TPOT (better serving, L211; speculative decoding, L210). Same E2E, opposite fixes — which is exactly why you never optimize a single "latency" number.
Crucial UX point: with streaming, the user does not experience E2E — they experience TTFT (when it starts) and TPOT (how fast it flows). E2E is the metric for non-streamed calls (a tool-use step your code waits on, a batch job). Know which one your product actually feels.
Throughput — What You Actually Pay For
TTFT, TPOT, and E2E are per-request (per-user) latency — what one person experiences. Throughput is the system-level view: how much work the server does in total. It's what fills the GPU and what your bill is made of, and it comes in two flavors:
- Output tokens/second (TPS) — total output tokens the server produces per second, across all concurrent requests. The headline capacity number.
- Requests/second (RPS) — completed requests per second. Useful when requests are similarly sized.
The trap is conflating per-user throughput with system throughput:
- Per-user throughput ≈ output_tokens / E2E ≈ 1/TPOT — the speed one user feels (~33 tok/s in our example).
- System throughput — the sum across everyone the server is serving at once (could be thousands of tok/s).
The fundamental tension — latency vs throughput. A GPU is most efficient when it works on many requests at once (a batch): one expensive read of the weights from memory serves the whole batch's decode step, so total tokens/second soars. But each individual user now waits in a queue (TTFT up) and shares the GPU (TPOT up). As you increase concurrency, system throughput rises until it saturates near the max batch size — while per-user latency keeps climbing. You cannot maximize both at once; you pick a point on the curve.
Latency is a per-user feeling; throughput is a fleet-wide bill. Tuning a serving system is mostly choosing where on the latency-throughput curve to sit for your SLOs.
That batch-vs-latency dial is the entire job of continuous batching (L209), running on top of the KV cache (L208) — and the dollar side is Token Economics (L213). Here, just internalize that lower per-user latency and higher system throughput pull in opposite directions.
Measure It Yourself — TTFT, TPOT & Throughput From a Real Stream
You can't optimize what you don't measure. The good news: TTFT and TPOT fall straight out of a streaming response. Start a timer, mark the moment the first chunk arrives (that's TTFT), let the stream finish (that's E2E), and read the exact output-token count from the response's usage to compute TPOT. Here it is against Claude's current streaming API:
import time
from anthropic import Anthropic

client = Anthropic()  # reads ANTHROPIC_API_KEY from the environment
PROMPT = "Explain the difference between latency and throughput in two sentences."

t0 = time.perf_counter()
ttft = None
with client.messages.stream(
    model="claude-opus-4-8",
    max_tokens=512,
    messages=[{"role": "user", "content": PROMPT}],
) as stream:
    for _ in stream.text_stream:               # fires once per streamed text chunk
        if ttft is None:
            ttft = time.perf_counter() - t0     # <-- TTFT: the first token has arrived
    final = stream.get_final_message()          # full message + exact usage
e2e = time.perf_counter() - t0

out_tokens = final.usage.output_tokens          # a chunk != a token -> use usage, don't count chunks
tpot = (e2e - ttft) / max(out_tokens - 1, 1)    # <-- TPOT: avg gap per generated token

print(f"TTFT   {ttft * 1000:6.0f} ms")
print(f"TPOT   {tpot * 1000:6.1f} ms/tok   ({1 / tpot:5.1f} tok/s)")
print(f"E2E    {e2e:6.2f} s      ({out_tokens} output tokens)")
print(f"thru   {out_tokens / e2e:6.1f} tok/s  (this one request, end to end)")
A typical run prints something like:
TTFT      310 ms
TPOT     28.5 ms/tok   ( 35.1 tok/s)
E2E      2.94 s      (96 output tokens)
thru     32.7 tok/s  (this one request, end to end)
The same shape works for OpenAI — stream the response and mark the first chunk:
import time
from openai import OpenAI

client = OpenAI()
t0 = time.perf_counter()
ttft = None
stream = client.chat.completions.create(
    model="gpt-5.5",
    messages=[{"role": "user", "content": "Explain latency vs throughput in two sentences."}],
    stream=True,
    stream_options={"include_usage": True},   # ask for token usage in the final chunk
)
out_tokens = 0
for chunk in stream:
    if chunk.choices and chunk.choices[0].delta.content and ttft is None:
        ttft = time.perf_counter() - t0        # first token
    if chunk.usage:                            # final chunk carries usage
        out_tokens = chunk.usage.completion_tokens
e2e = time.perf_counter() - t0
tpot = (e2e - ttft) / max(out_tokens - 1, 1)
print(f"TTFT {ttft*1000:.0f} ms | TPOT {tpot*1000:.1f} ms/tok | E2E {e2e:.2f} s")
Three things to get right when you measure:
- A streamed chunk is not a token. One
text_streamchunk can carry several tokens (or a partial one). For the TPOT denominator always use the exact count fromusage.output_tokens, never the number of chunks. - This is a client-side, single-request measurement — it includes network latency, so it tells you what a user feels, not the raw server speed. To benchmark a server, drive it with a load tool (genai-perf, the vLLM benchmark,
llmperf) at a fixed concurrency and report percentiles — that's the only way to separate per-user latency from system throughput cleanly (next two sections). - Warm up first. The first request after a cold start (or a cache miss) is an outlier; discard it before averaging.
Beyond the Average — Percentiles & Goodput
Two more ideas separate a real production view from a toy benchmark. Both come down to the same lesson: a single averaged number hides the experience that actually loses users.
1. Report percentiles, not the mean. Latency is famously skewed — most requests are fast, a few are awful. The mean gets dragged around by those few and describes nobody. So measure the distribution:
- p50 (median) — the typical user's experience.
- p95 / p99 (the tail) — the slowest 5% / 1%. This is where the rage-quits live, and on a busy server it can be many times the median.
A model with a great average TTFT but a p99 of 8 seconds has a serious problem the average will never show you. SLOs are always written on percentiles — e.g. "p95 TTFT < 500 ms" — not on means.
2. Goodput, not raw throughput. Here's the punchline of the whole lesson. Raw throughput counts every completed request — including the slow ones that already failed the user. Goodput counts only the requests that completed and met your SLO (both TTFT and TPOT targets). It's throughput that actually delivered a good experience.
Goodput = completed requests per second that satisfy the SLO (e.g. TTFT < 200 ms and TPOT < 50 ms for ≥ 90% of requests).
The gap is brutal and easy to hide. A server can report 10 requests/second of throughput while only 3 of them met the latency targets — its goodput is 3 req/s. Optimizing raw throughput would tell you everything is fine while 70% of users have a bad time. This is why goodput is the metric modern serving research optimizes: splitting prefill and decode onto separate hardware (DistServe, 2024) raised goodput 2-3x at the same SLO, even though raw throughput barely moved. Optimize goodput; report the tail; treat the mean with suspicion.
See It — The Latency Lab
Time to make the two clocks tangible. Below, a single request is drawn as a timeline: the violet PREFILL block is TTFT (the wait for the first token), and the decode ticks are spaced by TPOT (the pace of every token after). Pick a workload and flip the server between idle and busy:
Three things to watch:
- A long prompt inflates TTFT (summarize a long doc: a big violet prefill block — you wait before anything appears), while a long answer inflates E2E (long report: tiny prefill, a long decode tail). Same family of numbers, opposite shape — that's the E2E formula made visual.
- The SLO verdict flips. A request can complete and still be a goodput miss if it blows the TTFT or TPOT target — exactly the gap between throughput and goodput.
- Go busy and per-user TTFT and TPOT both rise while system throughput climbs — the latency-vs-throughput trade-off you'll spend the next lessons learning to tune.
🧪 Try It Yourself
Reason through these, then use the Latency Lab to confirm:
- Predict: switch from Chatbot reply to Summarize a long doc. Which metric jumps the most, and why?
- Your Long report has a 45 s end-to-end latency and users are happy. How is that possible — what are they actually feeling?
- A request finishes successfully but its TTFT is 1.2 s against a 500 ms SLO. Does it count toward throughput? Toward goodput?
- You flip the server to busy and system throughput doubles, but support tickets about "slowness" spike. What happened, and which two metrics would prove it?
- A teammate reports "average TTFT is 180 ms, we're fine." What's the one follow-up question that could change the conclusion?
→ (1) TTFT jumps — a 16K-token prompt means a much longer prefill before the first token (compute-bound, grows with prompt length); TPOT barely changes. (2) With streaming, they never wait for E2E — they feel a fast TTFT (~120 ms) and a comfortable TPOT (~33 tok/s, faster than they read), so the 45 s total is invisible; they're reading the whole time. (3) It counts toward throughput (it completed) but not goodput (it missed the SLO) — that's the exact gap between the two. (4) Batching more users raised system throughput but each user now queues and shares the GPU, so per-user TTFT and TPOT rose — the latency-vs-throughput trade. Those two per-user metrics (ideally at p95/p99) would prove it. (5) "What's the p95/p99 TTFT?" — the mean hides the tail; a 180 ms average can sit on top of a 4 s p99 that's driving the complaints.
Mental-Model Corrections
- "Latency is one number." It's at least three — TTFT (first token), TPOT (each next token), and E2E (the whole thing). They have different causes and different fixes; collapsing them hides the problem.
- "Lower latency means higher throughput." Opposite — they trade off. Batching more requests raises system throughput but raises per-user TTFT and TPOT. You choose a point on the curve.
- "Throughput is the goal." Raw throughput counts requests that already failed the user. Optimize goodput — completed requests that meet the SLO.
- "A long total response time is bad UX." Not if it streams. With a good TTFT and a TPOT above reading speed, a 40 s answer feels fine — the user reads as it writes. E2E only bites on non-streamed calls.
- "TTFT depends on the model." Mostly it depends on prompt length (prefill) and queueing (load). The same model has very different TTFT for a 200-token vs a 100K-token prompt.
- "Report the average." The mean is dragged by the tail and describes nobody. Report p50 / p95 / p99; write SLOs on percentiles.
- "Generation is slow because the GPU is weak." Decode is memory-bandwidth-bound, not compute-bound — it's limited by moving the weights out of memory each step, which is why the GPU sits at ~20-40% utilization (and why the KV cache and batching, L208-L209, matter so much).
Key Takeaways
- A request has two clocks. Prefill (compute-bound, processes the whole prompt) sets TTFT; decode (memory-bandwidth-bound, one token at a time) sets TPOT. Two phases, two metrics.
- TTFT — time to first token: the "is it alive?" wait. Grows with prompt length. Targets: autocomplete < ~100 ms, chat < ~500 ms.
- TPOT / ITL — time per output token: the decode pace. ≥ ~10 tok/s (≤100 ms/tok) streams faster than you read.
TPOT = (E2E − TTFT) / (output − 1). - E2E = TTFT + TPOT × (output − 1). Same E2E can be prefill-dominated or decode-dominated — opposite fixes. With streaming, users feel TTFT + TPOT, not E2E.
- Throughput is system-level (tokens/s, req/s) — what you pay for. Per-user throughput ≈ 1/TPOT. Latency and throughput trade off: more batching → more system throughput, worse per-user latency.
- Measure from a stream: time the first chunk (TTFT), finish (E2E), use
usage.output_tokensfor TPOT. A chunk ≠ a token. Benchmark servers at fixed concurrency with percentiles. - Report the tail (p50/p95/p99), not the mean; optimize goodput — completed requests that meet the SLO — not raw throughput.
- Next — L208: The KV Cache — the single most important reason decode is fast enough to be practical at all, and the foundation for batching (L209) and the rest of the serving stack.