Tail Latency: Living at p99
Introduction
Every tool so far in this section has fought a failure: a dependency that died, a pool that filled, a flood that had to be shed. This lesson fights something quieter and, in some ways, harder, because nothing is broken. Every server is up. Every request succeeds. The average response time looks great on the dashboard. And your users are still furious, because a meaningful slice of them are waiting far longer than the average ever admits.
That slice is the tail — the slowest few percent of requests — and the argument of this lesson is that at scale, the tail is not a rounding error you can ignore. It is the experience. Load Shedding & Graceful Degradation left you with the promise that shedding defends the tail; the assumption underneath was that a tail is always there to defend against, even in a perfectly healthy system. It is. Your average latency is a comforting lie told by a number that buries its worst cases in a crowd of good ones. Your users don't live in the average. They live in the tail, and the more of your system a single user touches, the deeper into that tail they live.
Why the Average Lies
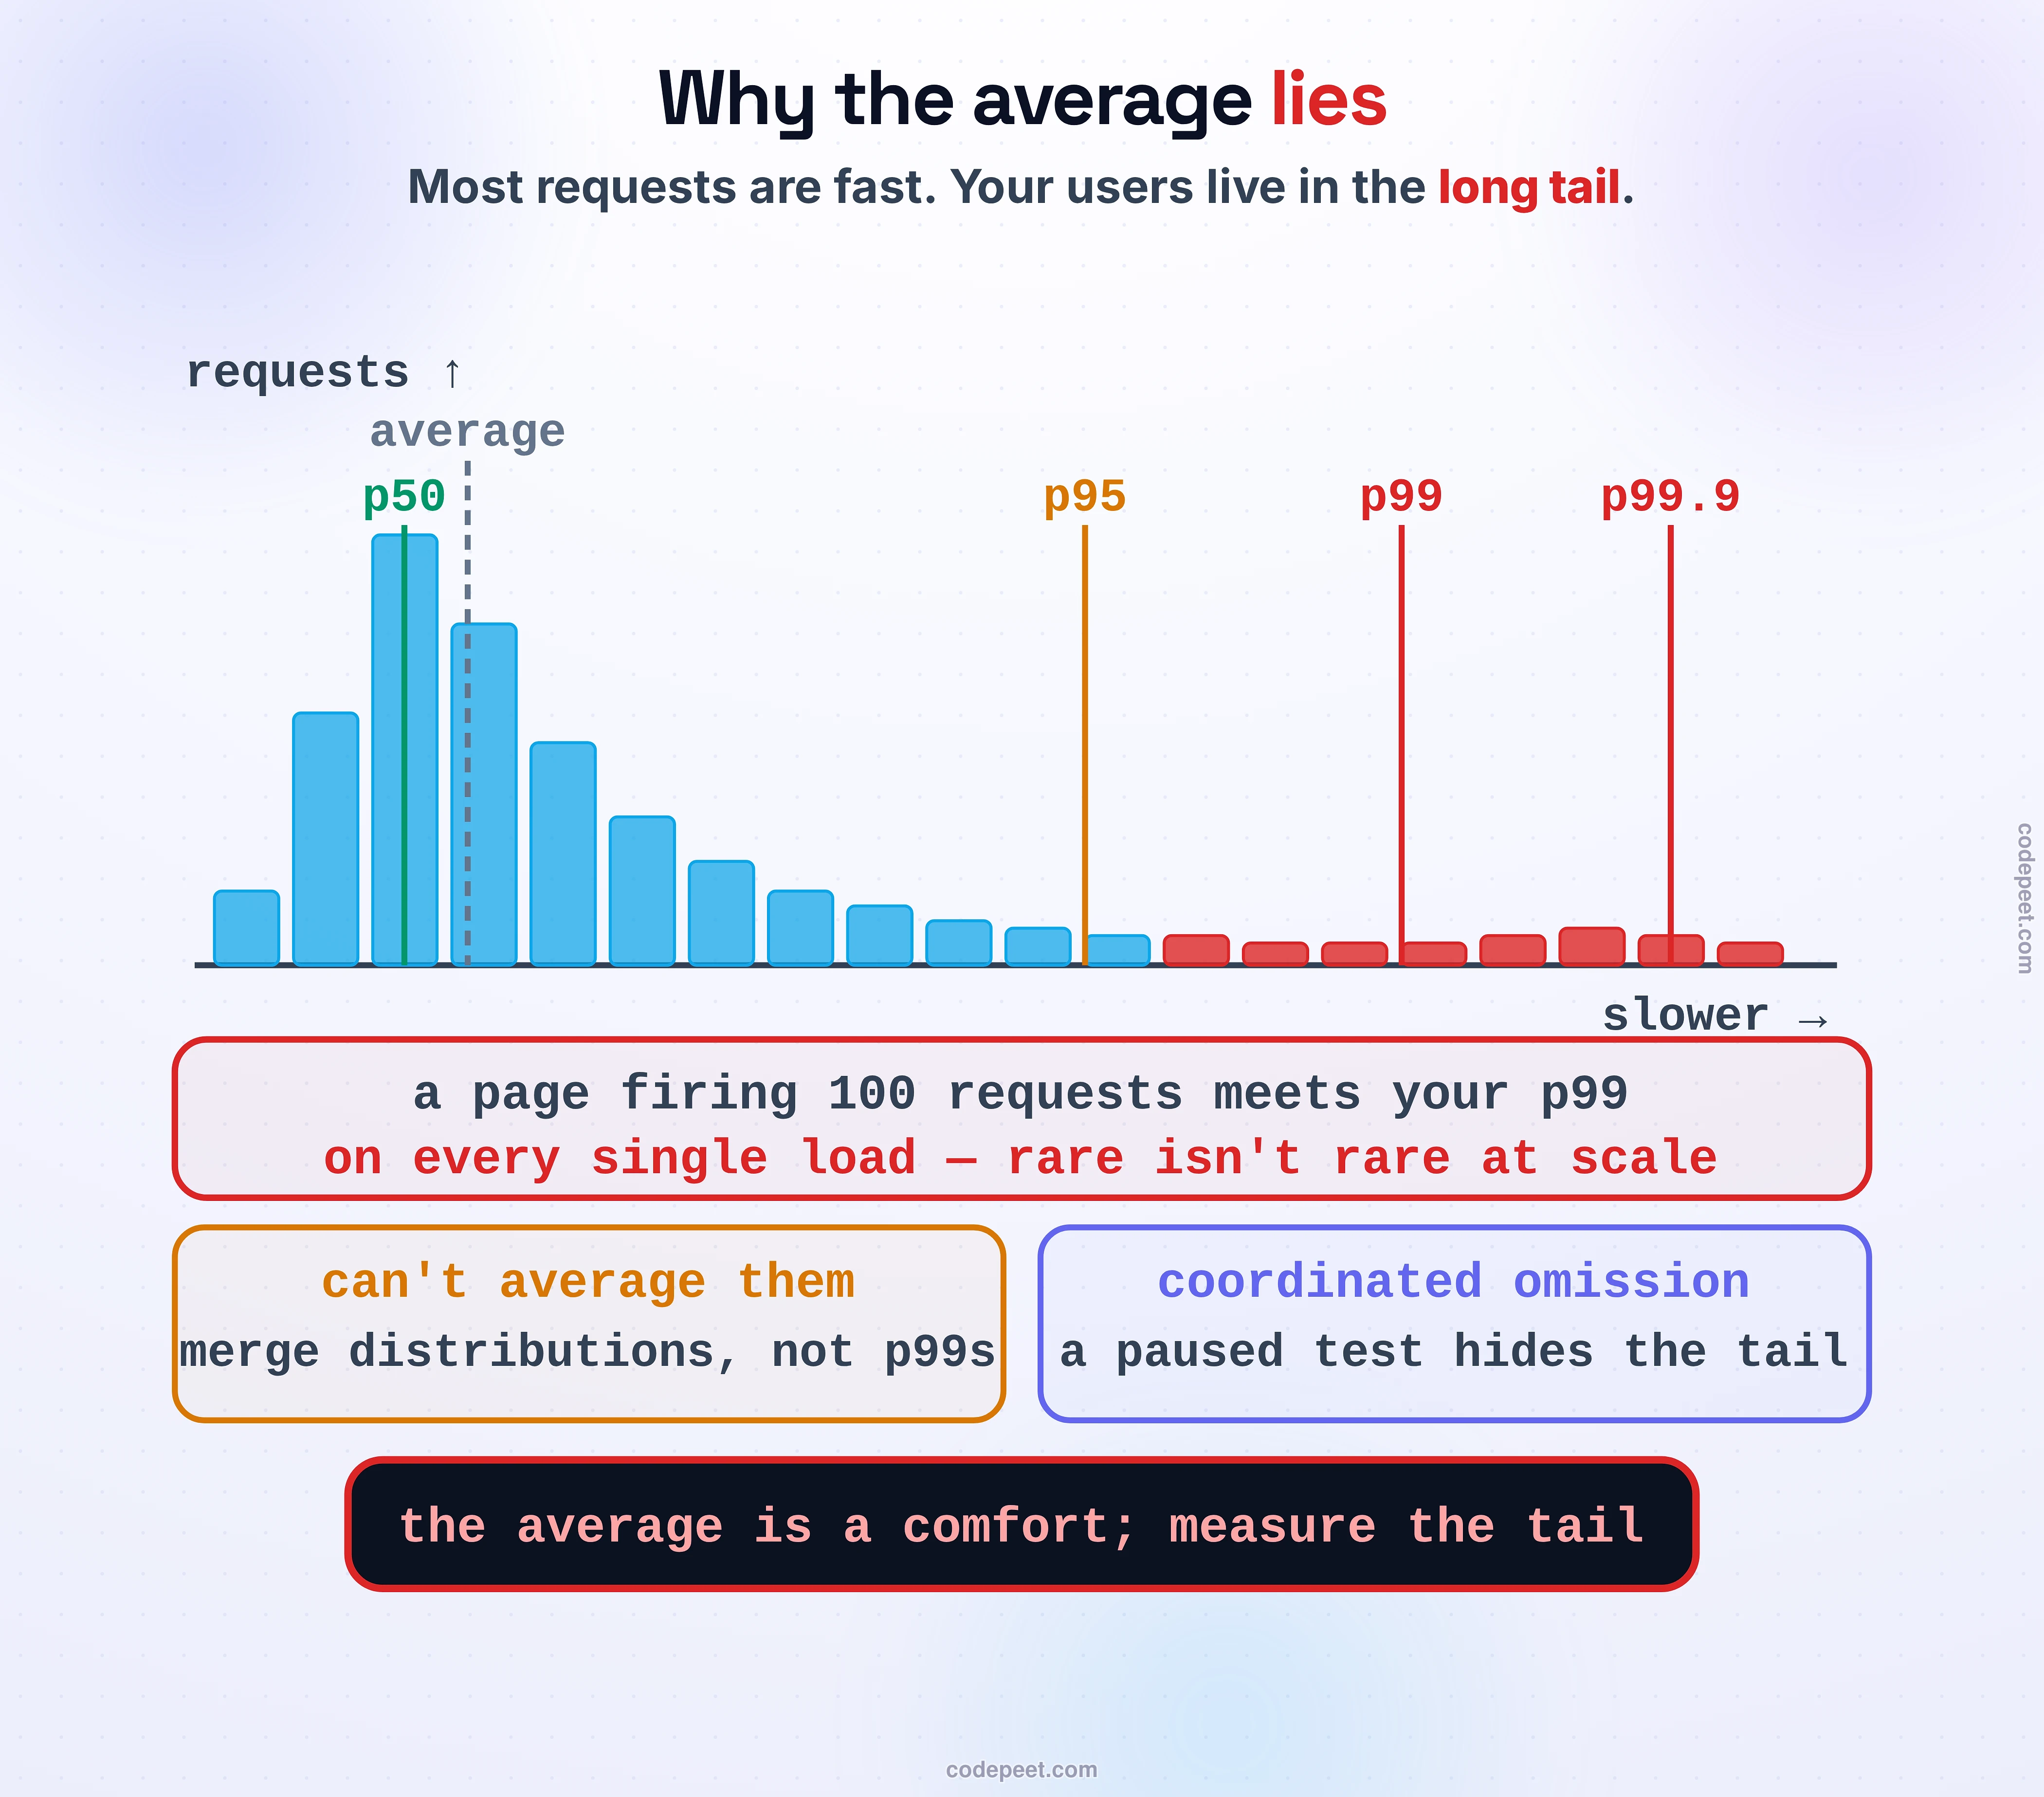
Start with the number everyone reaches for and why it betrays you. An average latency takes your fast requests and your slow requests and blends them into one comfortable figure that describes almost nobody. If ninety-nine requests take 10ms and one takes a full second, the average is about 20ms, a number that neither the ninety-nine nor the one ever experienced. The average doesn't just hide the tail; it launders it.
The honest way to talk about latency is in percentiles, which you met in Latency vs Throughput vs Bandwidth: the p50 (the median, what a typical request sees), the p95, the p99, the p99.9. Read "p99 is 200ms" as "one request in a hundred takes at least 200ms." The reframe this lesson adds is the one that changes how you think: which percentile is your user's reality depends on how many times they roll the dice. A user who makes a single request lives near your p50. But a single web page that fires 100 requests to render will, on average, hit your p99 once every time it loads — so your p99 is not a rare event for that page, it is the normal event, and your p99.9 shows up constantly. Rare stops being rare when you roll the dice enough times.
Two traps make the tail even easier to fool yourself about. First, you cannot average percentiles. The p99 of ten servers is not the average of their ten individual p99s; there is no arithmetic that recovers a fleet-wide percentile from per-server summaries, so you have to merge the actual distributions. Second, coordinated omission, a trap named by Gil Tene: a load test that waits for each response before sending the next request will, the moment the server stalls, politely stop sending too, and never record the requests that would have piled up during the stall. It measures the server on its good behavior and misses the tail entirely, which is why so many latency benchmarks report numbers far rosier than production. Measure the distribution, honestly, or you are optimizing a fiction.
The Tail at Scale: Fan-Out Amplification
Here is the idea that turns tail latency from a single-server annoyance into the defining problem of large systems, and it is the heart of this lesson. It comes from a 2013 paper by Jeff Dean and Luiz Barroso, The Tail at Scale, and once you see it you cannot unsee it.
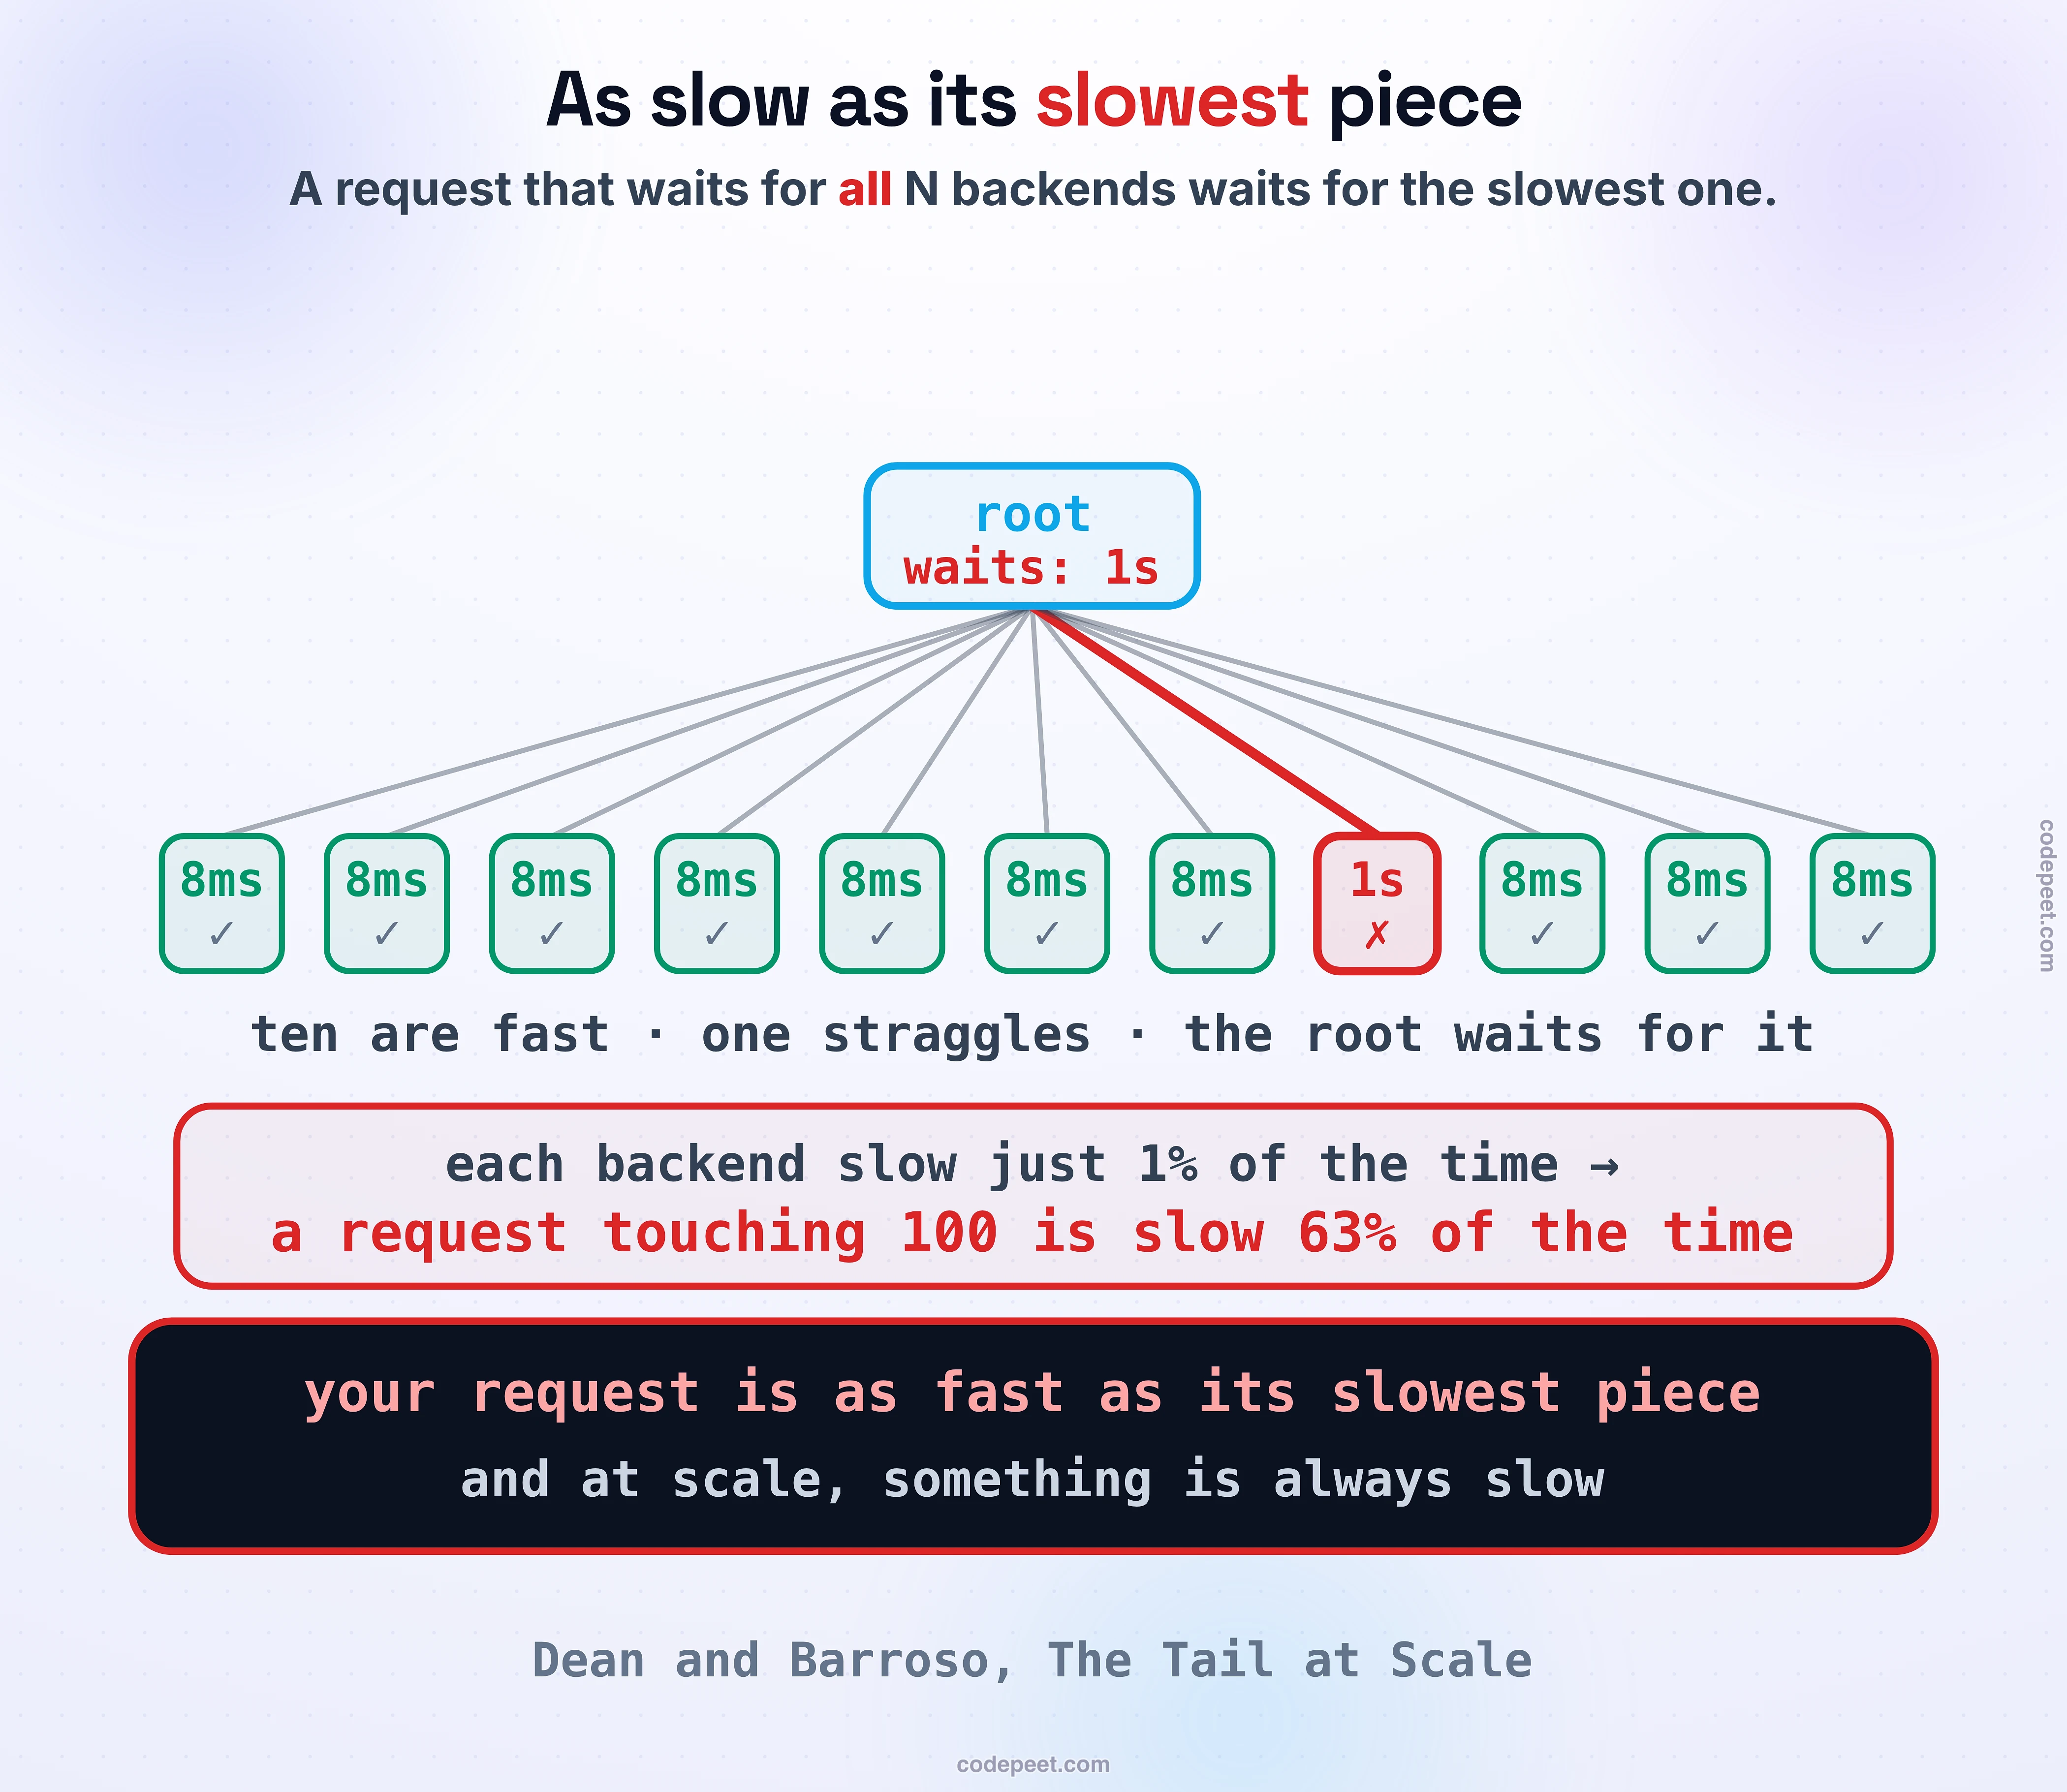
Most large requests fan out. To render one page or answer one query, a root server sends the work to many backends in parallel — shards of an index, partitions of a table, a dozen microservices — and then it has to wait for all of them before it can reply. And a request that waits for all of them is only as fast as the slowest one. Your end-to-end latency is not the average of the backends; it is the maximum.
Now do the arithmetic, because it is brutal. Suppose each backend is fast almost always and slow just 1 percent of the time — a 99th-percentile hiccup, the kind you'd shrug at on a single server. If your request touches one backend, it's slow 1 percent of the time. If it touches a hundred backends and waits for all, the chance that at least one is having its bad moment is one minus the chance they're all fine: 1 minus 0.99 to the hundredth power, which is about 63 percent. Rephrase that: the rare, ignorable, once-in-a-hundred slow event on a single server becomes the majority case for a request that fans out to a hundred. In the same paper's numbers, a per-backend p99 of 10ms turns into an end-to-end p99 near 140ms. The tail didn't shrink as you scaled out; it grew, and it grew precisely because you scaled out. That is the opposite of what intuition promises, and it is why tail latency is a distributed-systems problem that a faster CPU cannot solve.
Where the Tail Comes From
If you're going to tolerate the tail, it helps to know what's making it, because the sources are ordinary and unavoidable — you will not engineer them away. They share one shape: each is a brief event that freezes or slows a single server at an unpredictable moment.
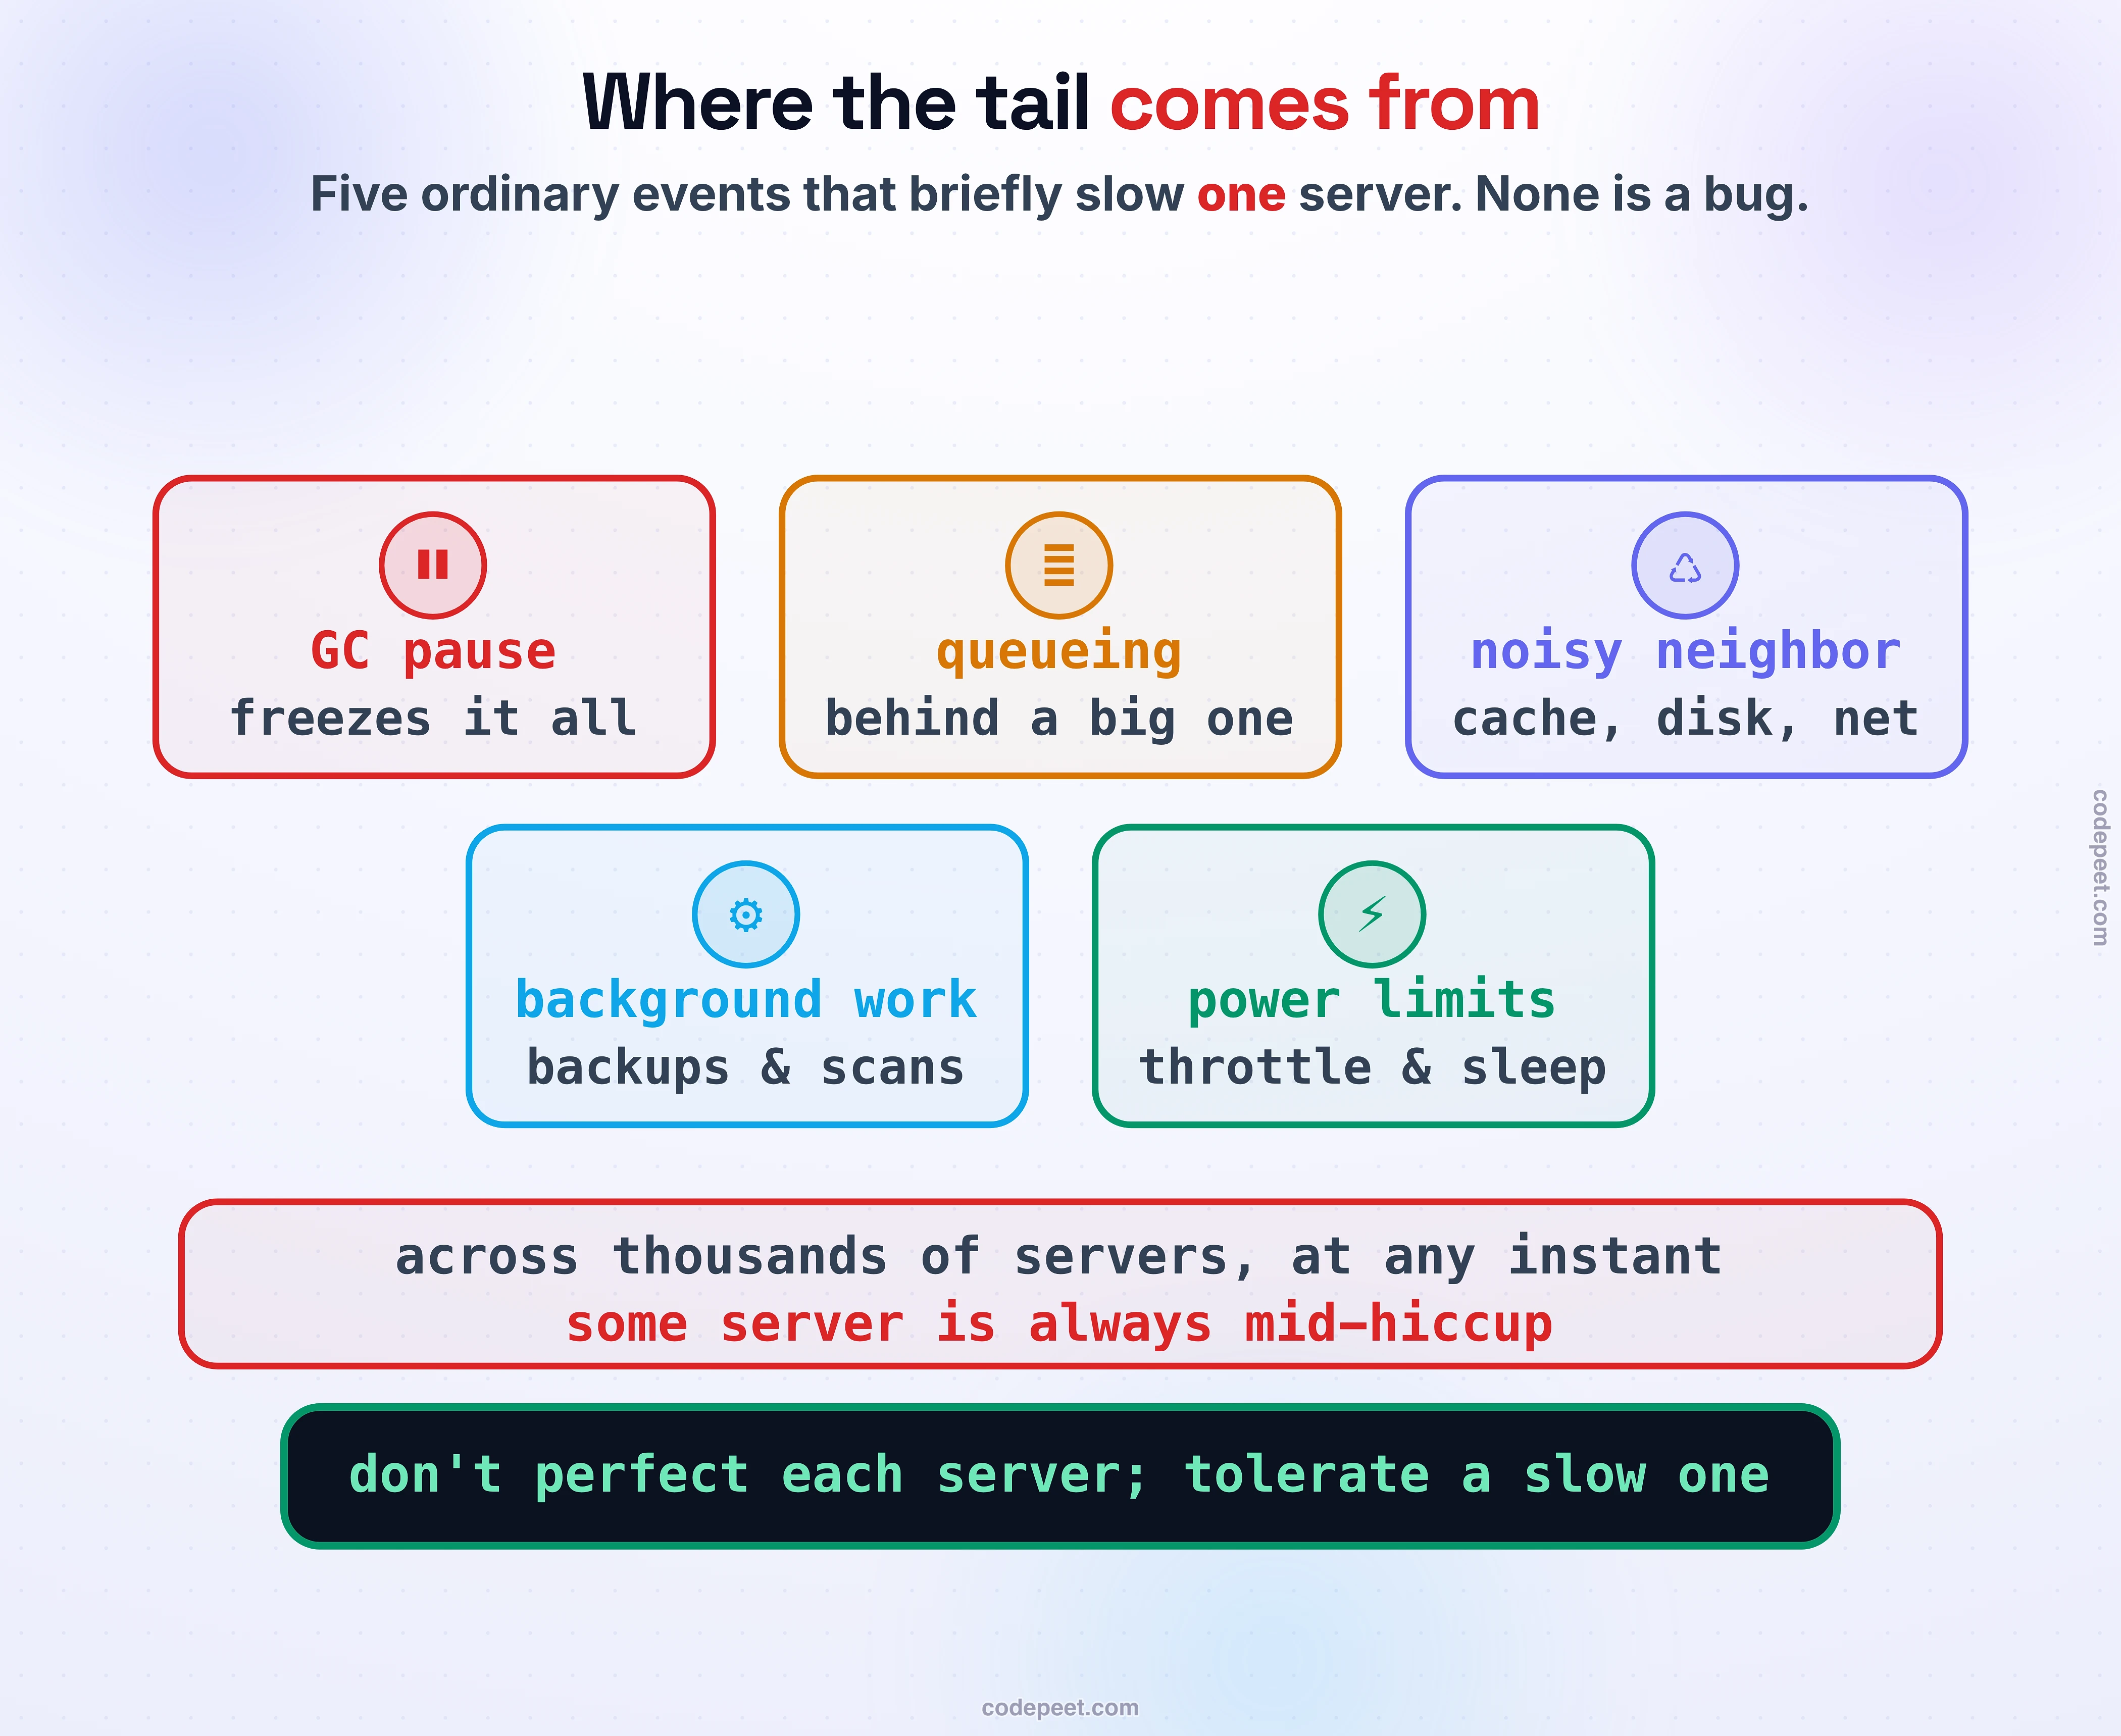
A garbage-collection pause stops an entire process cold for tens of milliseconds while it reclaims memory, and every request in flight on that process waits it out. Queueing: a small request arrives right behind a big one and waits its turn, through no fault of its own. A noisy neighbor on the same machine contends for the shared things you can't see — CPU caches, memory bandwidth, a disk, a network link — and steals microseconds that add up. Background work the machine has to do anyway — compacting logs, taking backups, running health scans, reindexing — briefly competes with live traffic. And power and energy management throttles a CPU that got too hot or takes a few extra milliseconds to wake a core from a sleep state.
None of these is a bug. None is going away. And here is why they matter so much together: at scale, across thousands of servers, at any given instant some of them are always doing one of these things. So a request that fans out widely almost always lands on at least one server mid-hiccup. This is the mindset shift the rest of the lesson rests on. You do not beat the tail by making each server perfect, because you can't. You beat it by building a system that stays fast even though one of its servers, right now, is slow.
Racing the Tail: Hedged and Tied Requests
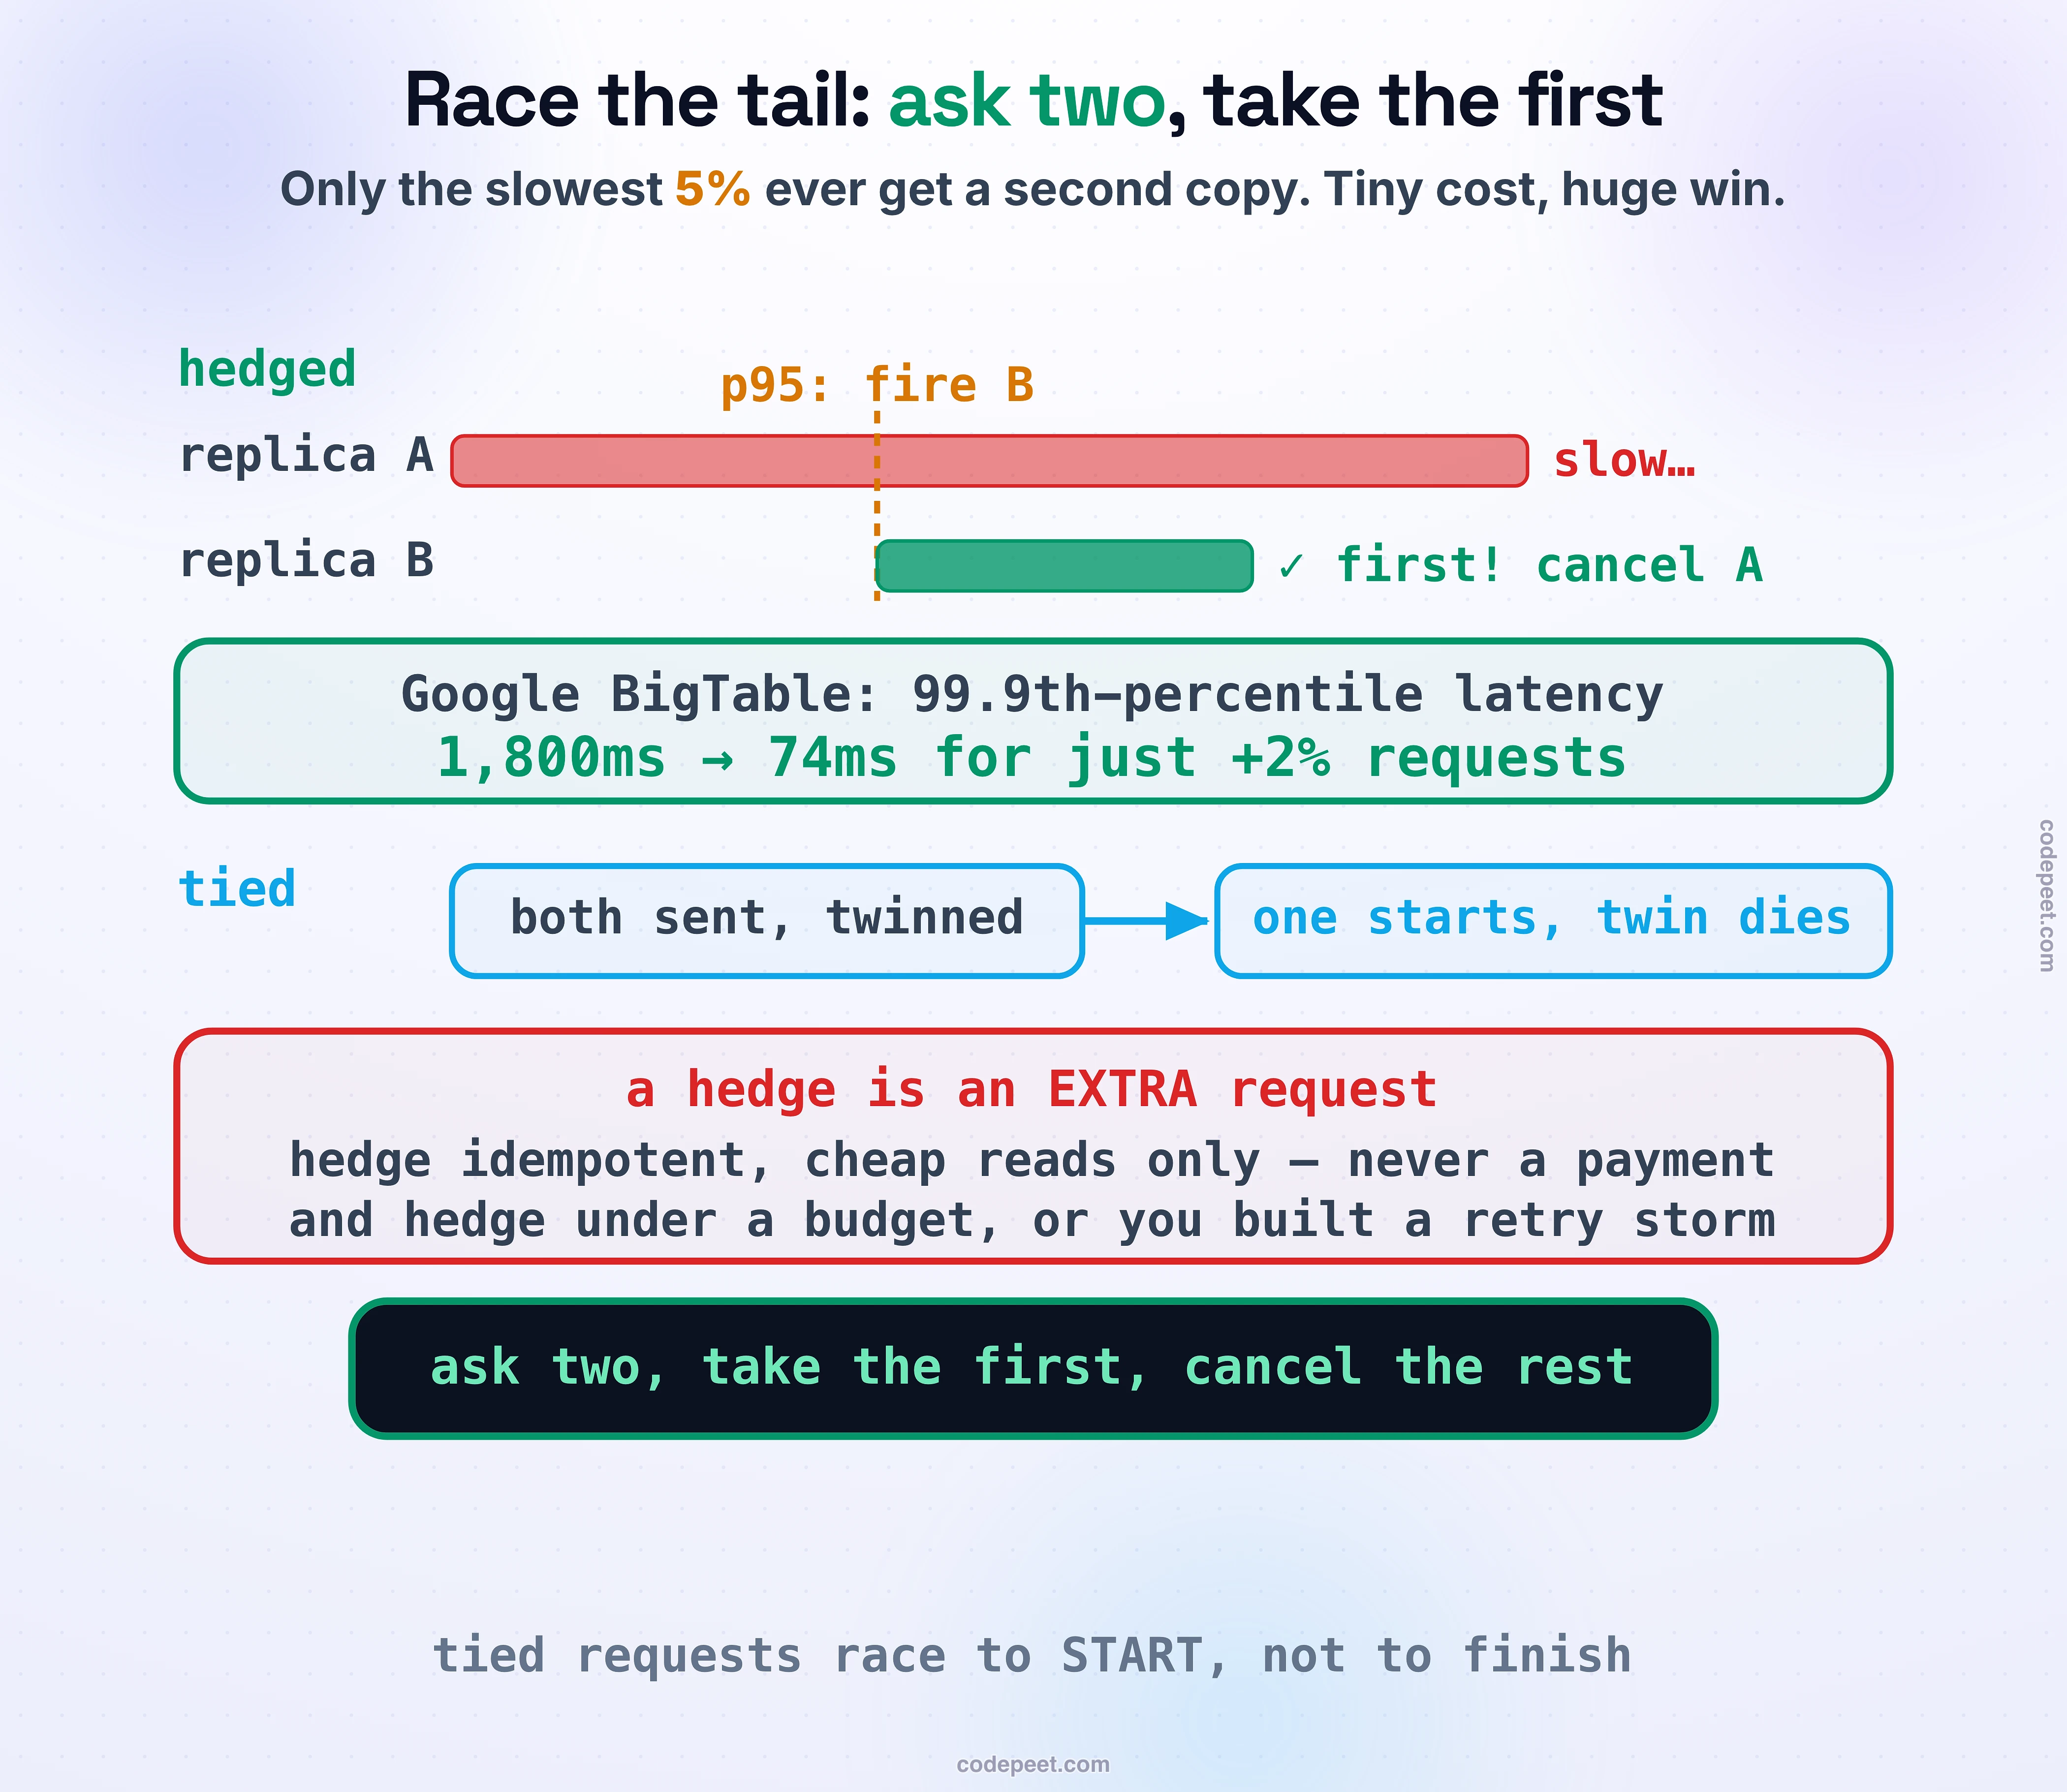
The most direct way to survive a slow replica is almost too simple: if one copy might be slow, ask two, and take whichever answers first. Done naively that doubles your load, but the trick from The Tail at Scale is to only ask twice for the requests that are actually running slow, which is a tiny fraction.
A hedged request does exactly that. Send the request to the best replica. If it hasn't answered within the 95th-percentile expected time for this kind of request, fire a second copy at a different replica, take whichever comes back first, and cancel the other. Because you only hedge once a request has already crossed into its slowest 5 percent, the extra load is small while the effect on the tail is enormous. The paper's headline result makes it concrete: reading a thousand keys spread across a hundred BigTable servers, a hedge sent after a short delay cut the 99.9th-percentile latency from 1,800ms to 74ms while issuing only 2 percent more requests. You spent two percent to erase a twenty-four-times worst case.
A tied request closes the one gap hedging leaves open: the window where both replicas start working on your request before either is cancelled, doing the work twice. In the tied version you send to two replicas at once, and each request carries the identity of its twin. The instant one replica actually dequeues the request to begin work, it sends a cancellation straight to the other. The two race to start, not to finish, so the duplicate almost never executes.
One hard rule keeps hedging from becoming a weapon you point at yourself. A hedge is an extra request, so it is only safe when that request is safe to run more than once: hedge idempotent, cheap reads (recall Idempotency: Safe to Retry), never a payment that would charge twice or an expensive model call you'd pay for twice for five percent of traffic, and never a stateful stream. And hedging that fires into a system already near its limit is the retry storm from Retries, Budgets & Retry Storms in a new costume: those second requests are real load. Hedge under a budget, and hedge only reads you can afford to send twice.
See It, Drive It: The Fan-Out Tail
The amplification is one of those facts that feels wrong until you watch it happen, so below is the fan-out in your hands. Set how many backends a request touches and how often each one runs slow.
Widen the fan-out and watch the odds that the whole request is slow climb the 1-minus-(1-p)-to-the-N curve: a per-backend blip you'd never notice on one server becomes a near-certainty once the request touches enough of them, because the end-to-end time tracks the slowest backend, not the average. Then switch on hedging and watch the tail fall back down as a second copy chases each straggler past the 95th-percentile mark, while a load meter shows how little extra traffic that costs. Finally, crank the hedge to fire on every request instead of only the slow ones, and watch the load meter explode as you rebuild the very overload the tail came from. The whole lesson lives in the gap between those two settings: a little redundancy, aimed only at the tail, buys almost all of the benefit for almost none of the cost.
The Toolbox, and When to Reach for Each
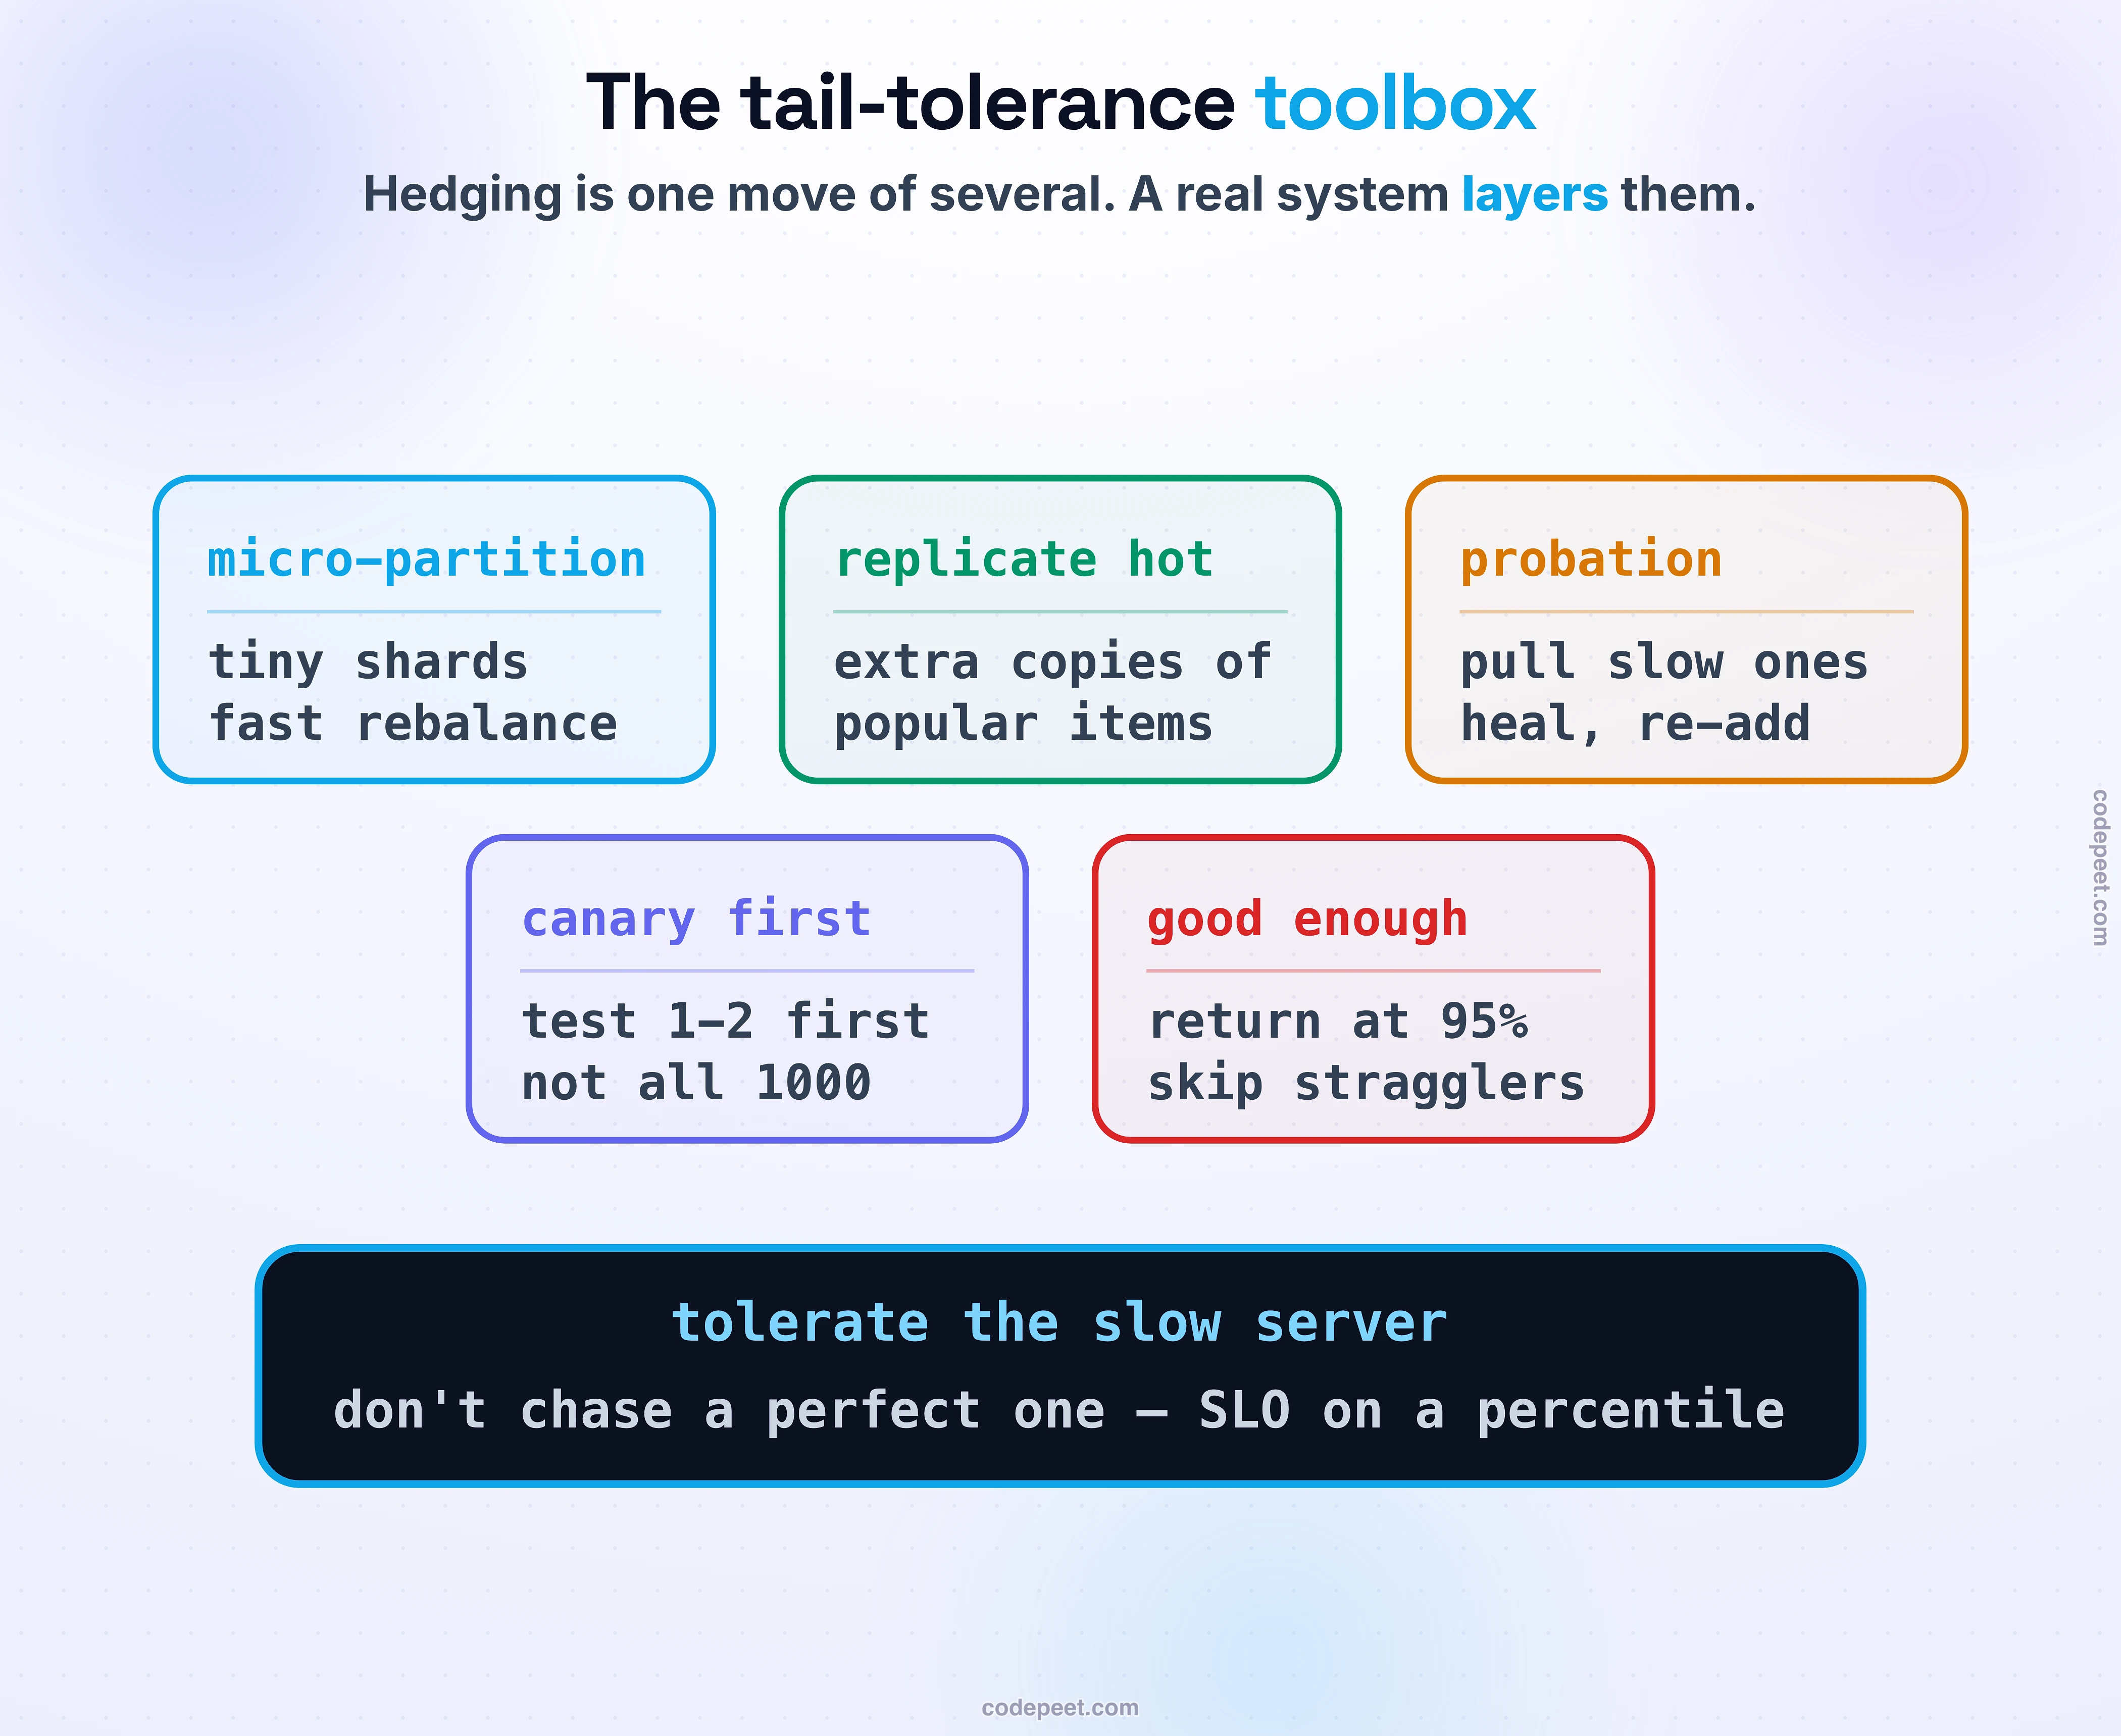
Hedging is the most famous move, but it is one of several, and a real system layers them. Each attacks the tail from a different angle.
Micro-partitioning cuts your data into many more partitions than you have machines — say twenty small partitions per server rather than one big one. Fine-grained pieces balance load far more evenly, and when a machine dies its twenty slices scatter across twenty other machines instantly instead of dumping one huge shard onto a single unlucky neighbor. Selective replication notices that some items are hot — a viral document, a celebrity's profile — and keeps extra copies of just those, so the popular items never bottleneck on one overworked replica. Latency-induced probation watches per-machine latency and quietly pulls a chronically slow server out of rotation, keeps sending it shadow requests to see whether it recovers, and slots it back in when it does. You lose a little capacity to gain a lot of predictability.
Two more are about spending the fan-out wisely. A canary request protects you from a poison input: before you fan a request out to a thousand leaf servers, send it to one or two first, and only fan out to the rest if they come back healthy — so a request that crashes its handler takes down two servers, not the fleet. And good-enough responses accept that for many fan-outs, completeness is optional: a search or a recommendation list that waits for the last straggling partition to answer is slower and barely better than one that returns as soon as 95 percent have replied. That is the graceful degradation of Load Shedding & Graceful Degradation pointed at latency instead of capacity. Underneath all of them is the same target you'll set explicitly in SLIs, SLOs & Error Budgets: a promise written on a percentile, because the average was never the thing your users felt.
Key Takeaways
- The average lies; your users live in the tail. Speak in percentiles (p50, p95, p99, p99.9). Which one is a user's reality depends on how many requests they make — a 100-request page meets your p99 on every load. You cannot average percentiles, and coordinated omission hides the tail from naive benchmarks.
- Fan-out amplifies the tail. A request that waits for all of N backends is as slow as the slowest, so a 1-percent per-backend hiccup becomes a 63-percent chance of a slow request across 100 backends (Dean & Barroso). Scaling out makes the tail worse, not better.
- The tail is made of ordinary, unavoidable events: GC pauses, queueing, noisy neighbors, background work, power management. At scale something is always slow, so build a system that tolerates a slow server rather than trying to perfect every one.
- Race the tail with hedged and tied requests. Send a second copy past the 95th-percentile mark and take the first (BigTable: 1,800ms to 74ms for +2 percent); tie them so the twin is cancelled the instant one starts. Only hedge idempotent, cheap reads, and hedge under a budget or you've built a retry storm.
- Layer the rest of the toolbox: micro-partitioning, selective replication of hot items, latency-induced probation, canary requests, good-enough responses. Set your SLO on a percentile, never the average.
One last thing the tail does, and it's the reason it earns a place in a section about overload. A slow response is not just slow. While it hangs, it is holding things: a worker thread, a connection, a slot in one of the bounded pools from Bulkheads, part of the time budget from Timeout Hierarchies. A fat tail doesn't stay politely in the tail. It backs up, fills the pools, and the slowness of one dependency becomes the slowness of everything waiting on it, which starts waiting on its callers, and so on. How a local slowness climbs the call graph into a system-wide outage is the last and largest failure mode of this section: Cascading Failures.