Rolling, Blue-Green, Canary
Something Is Running, and You Need to Replace It
You have an artifact you trust and a pipeline that can put it somewhere. Now the awkward part.
The thing you are replacing is currently running. People are using it right now, mid-checkout, mid-upload, mid-sentence. There is no moment when the system is idle and you can quietly swap the parts, because that moment stopped existing the day you promised to be available.
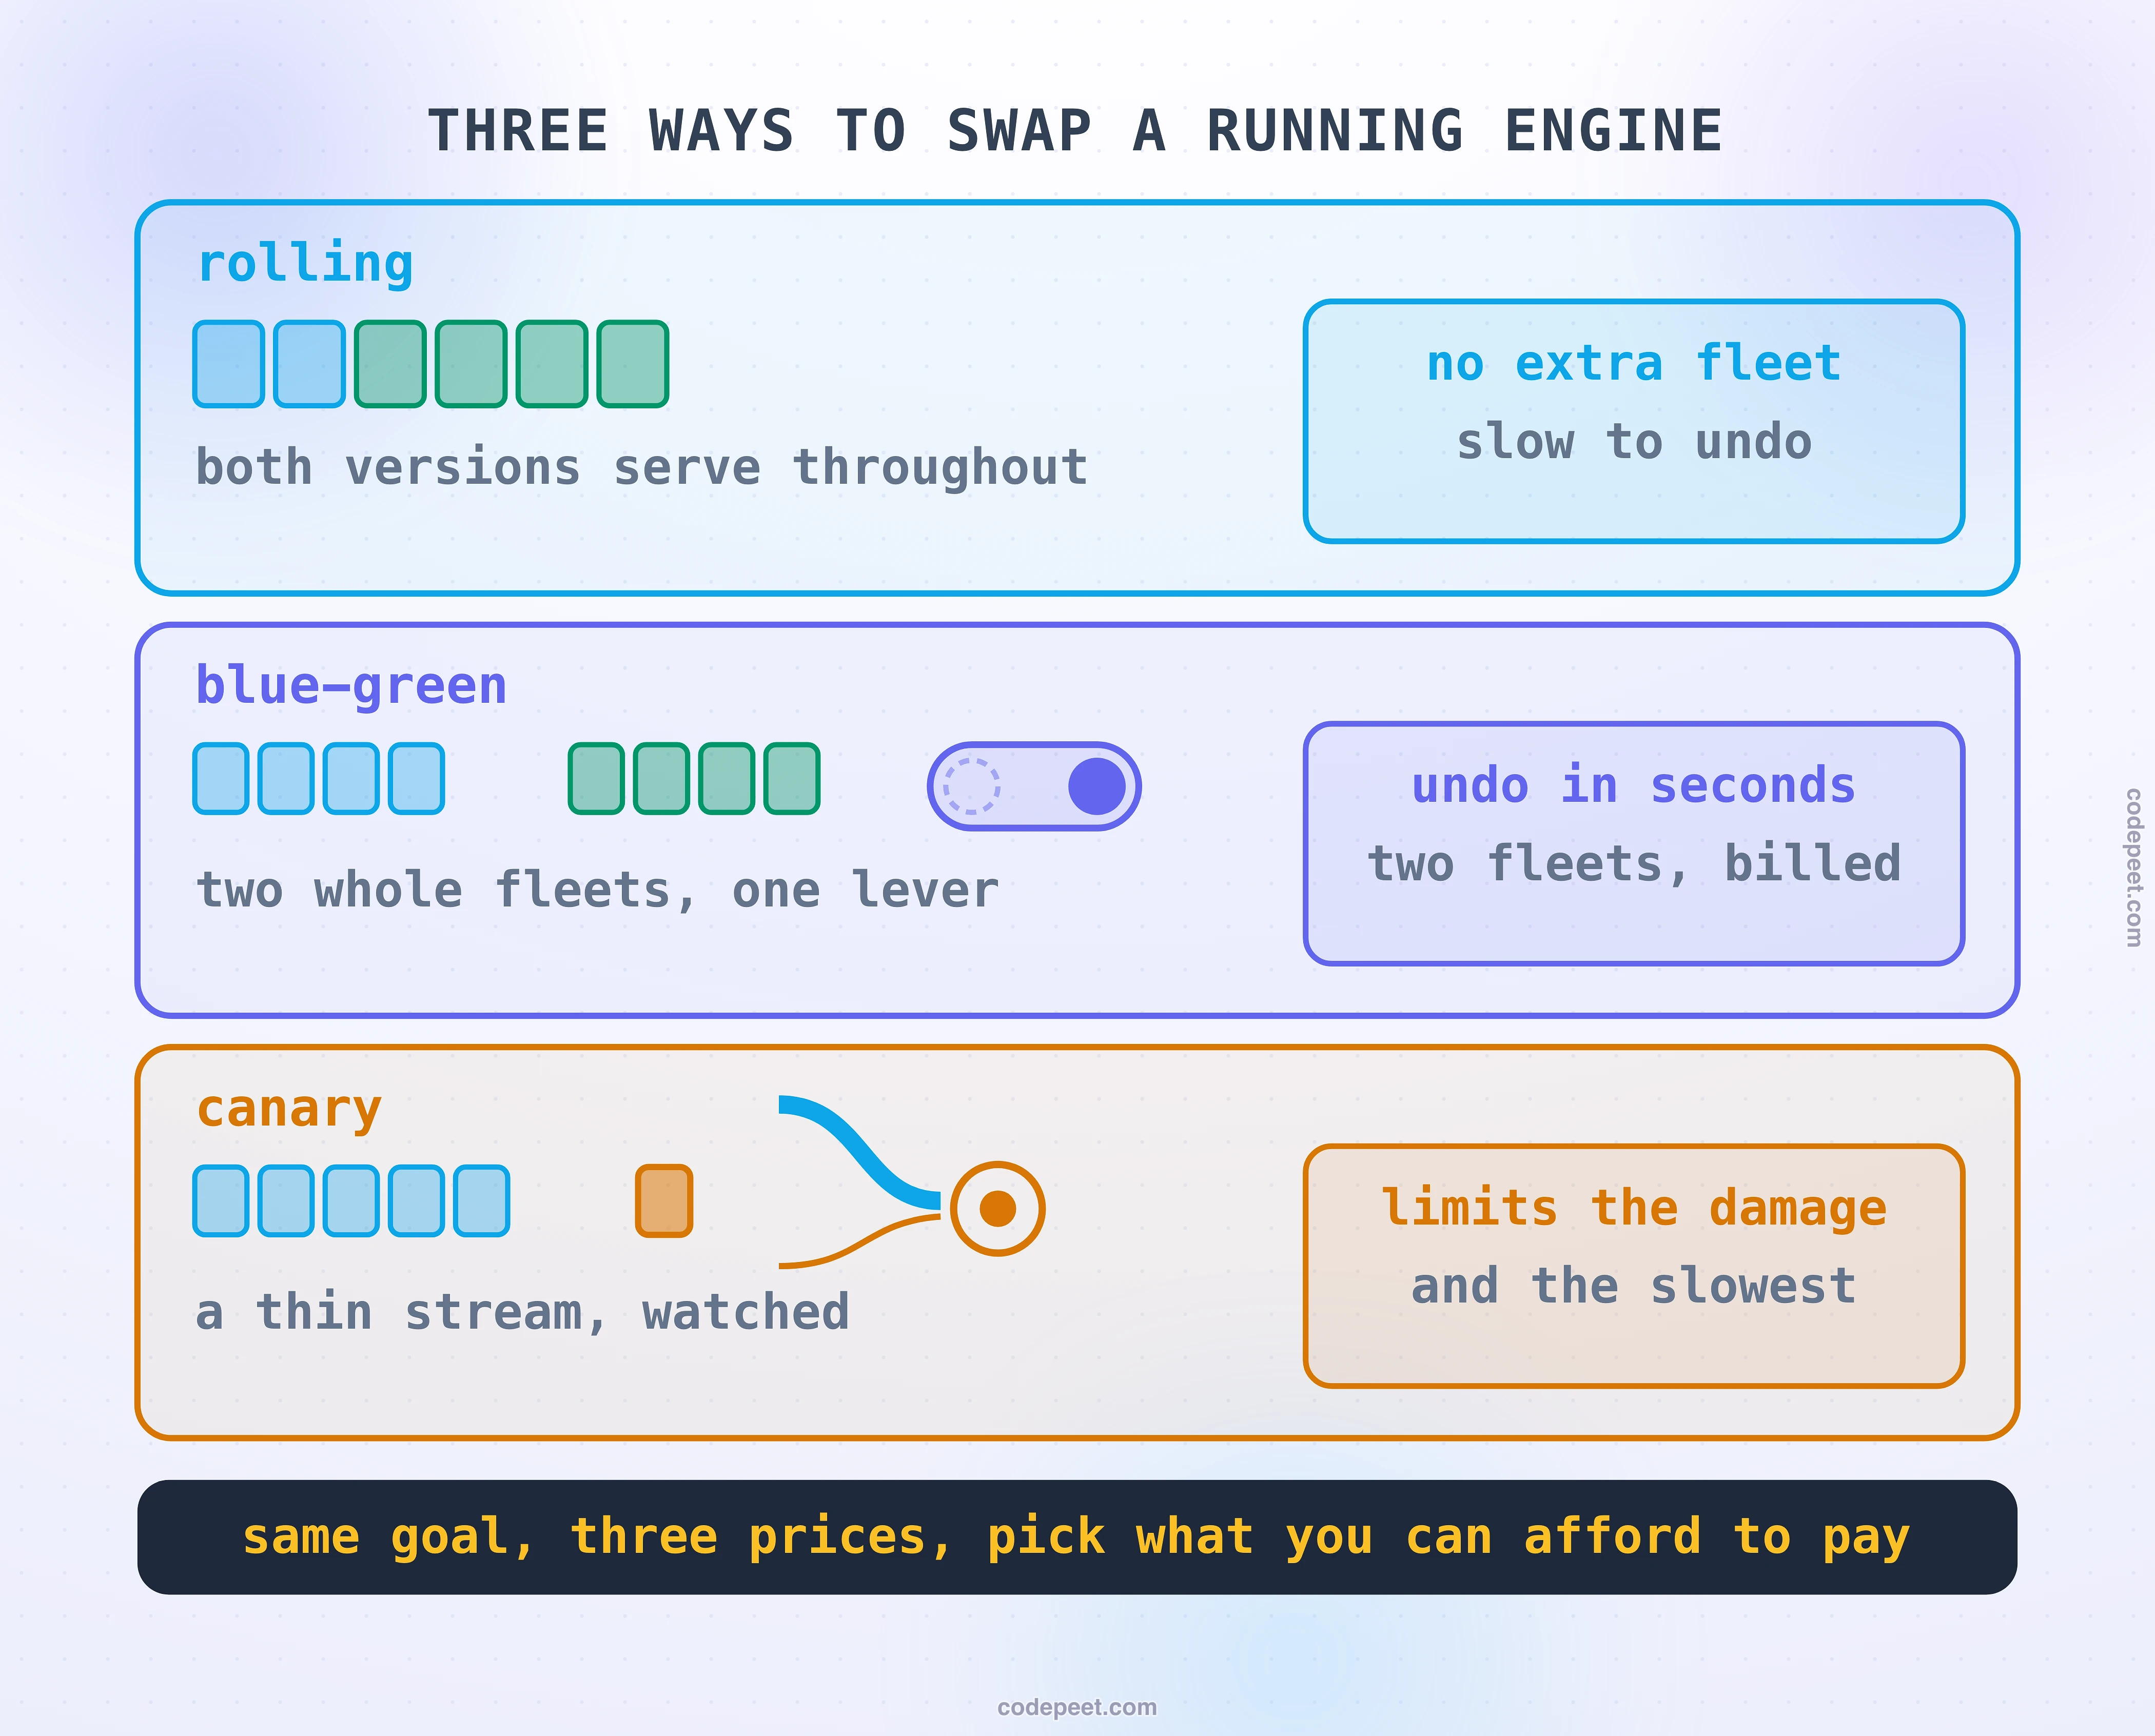
So every deployment is really the same physical problem: replace a working engine without stopping the vehicle. There are exactly three shapes of answer, and the difference between them is not sophistication. It is what each one asks you to pay.
Rolling swaps the fleet a piece at a time. Cheap, gradual, and slow to undo.
Blue-green builds a complete second fleet and switches everyone across at once. Instant to undo, and you pay for two fleets while you do it.
Canary sends a small share of real users to the new version, watches what happens to them, and only then decides. The only one of the three that limits the damage while the damage is happening, and the only one that requires you to have decided in advance what bad would look like.
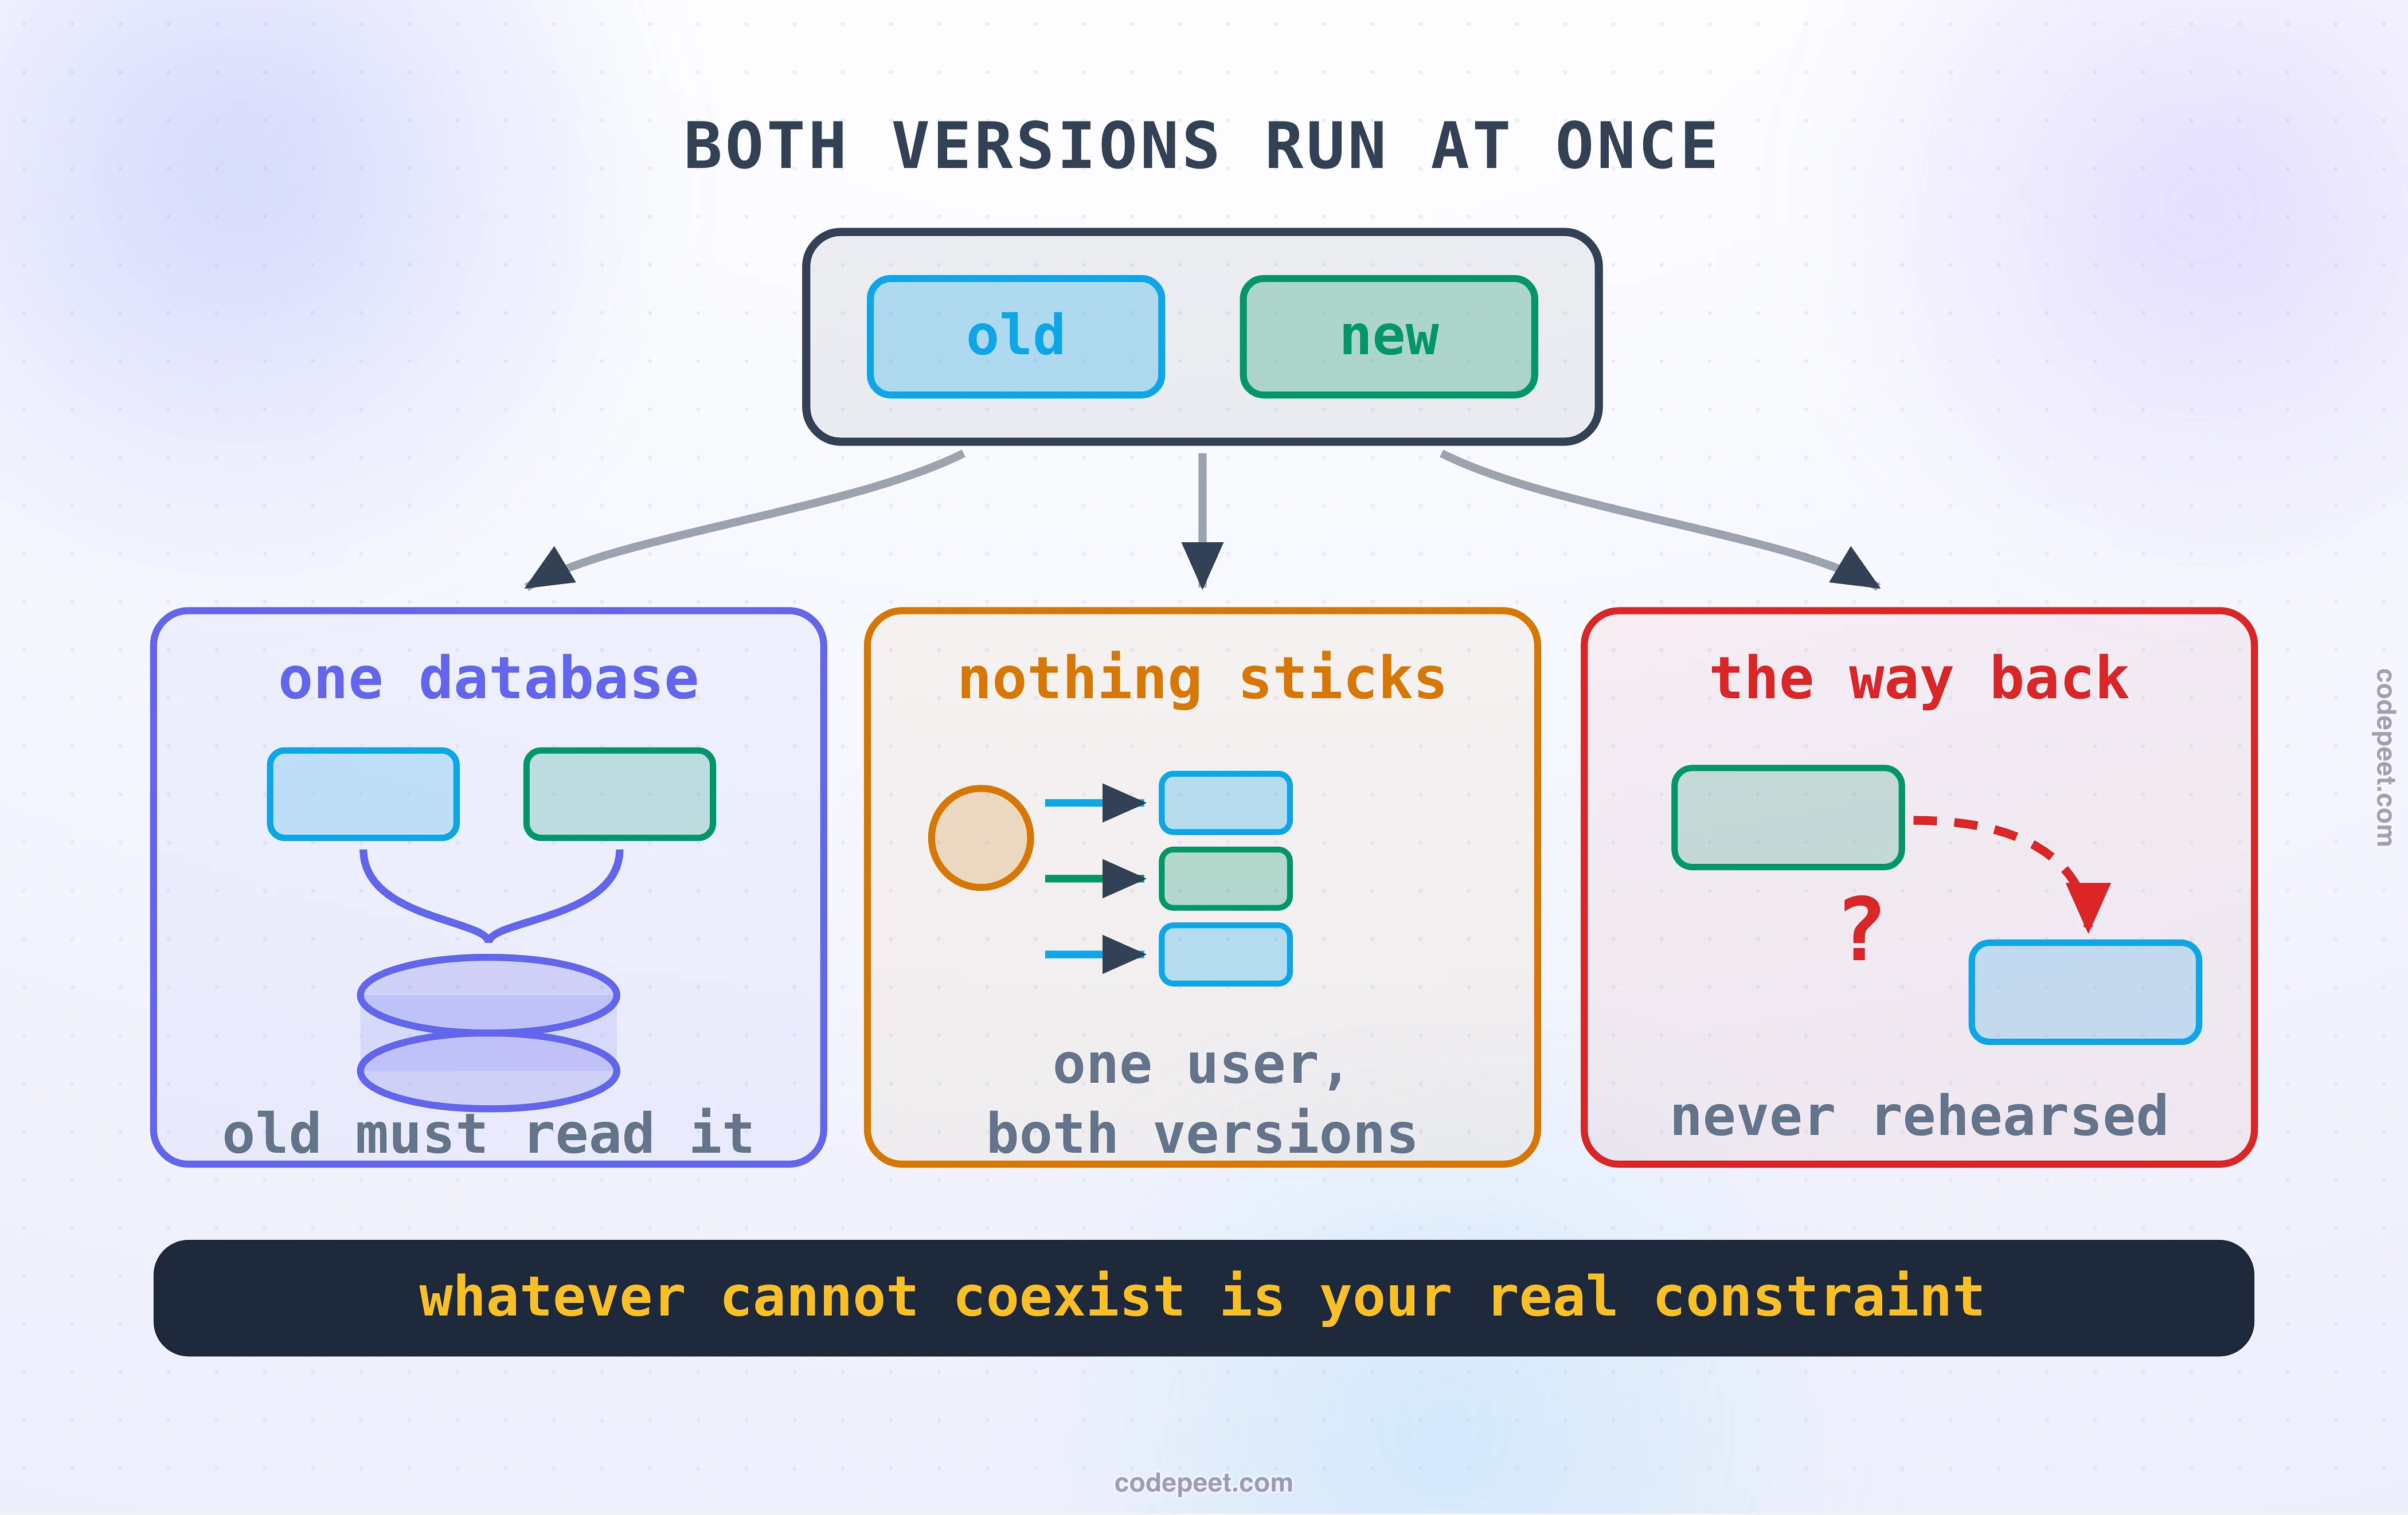
Every one of them rests on a single precondition that is easy to miss and expensive to discover late: for some period of time, both versions are live at once. Hold onto that, because most of the ways these strategies fail come from it.
Rolling: Replace It a Piece at a Time
The default nearly everywhere, and the one you get without asking.
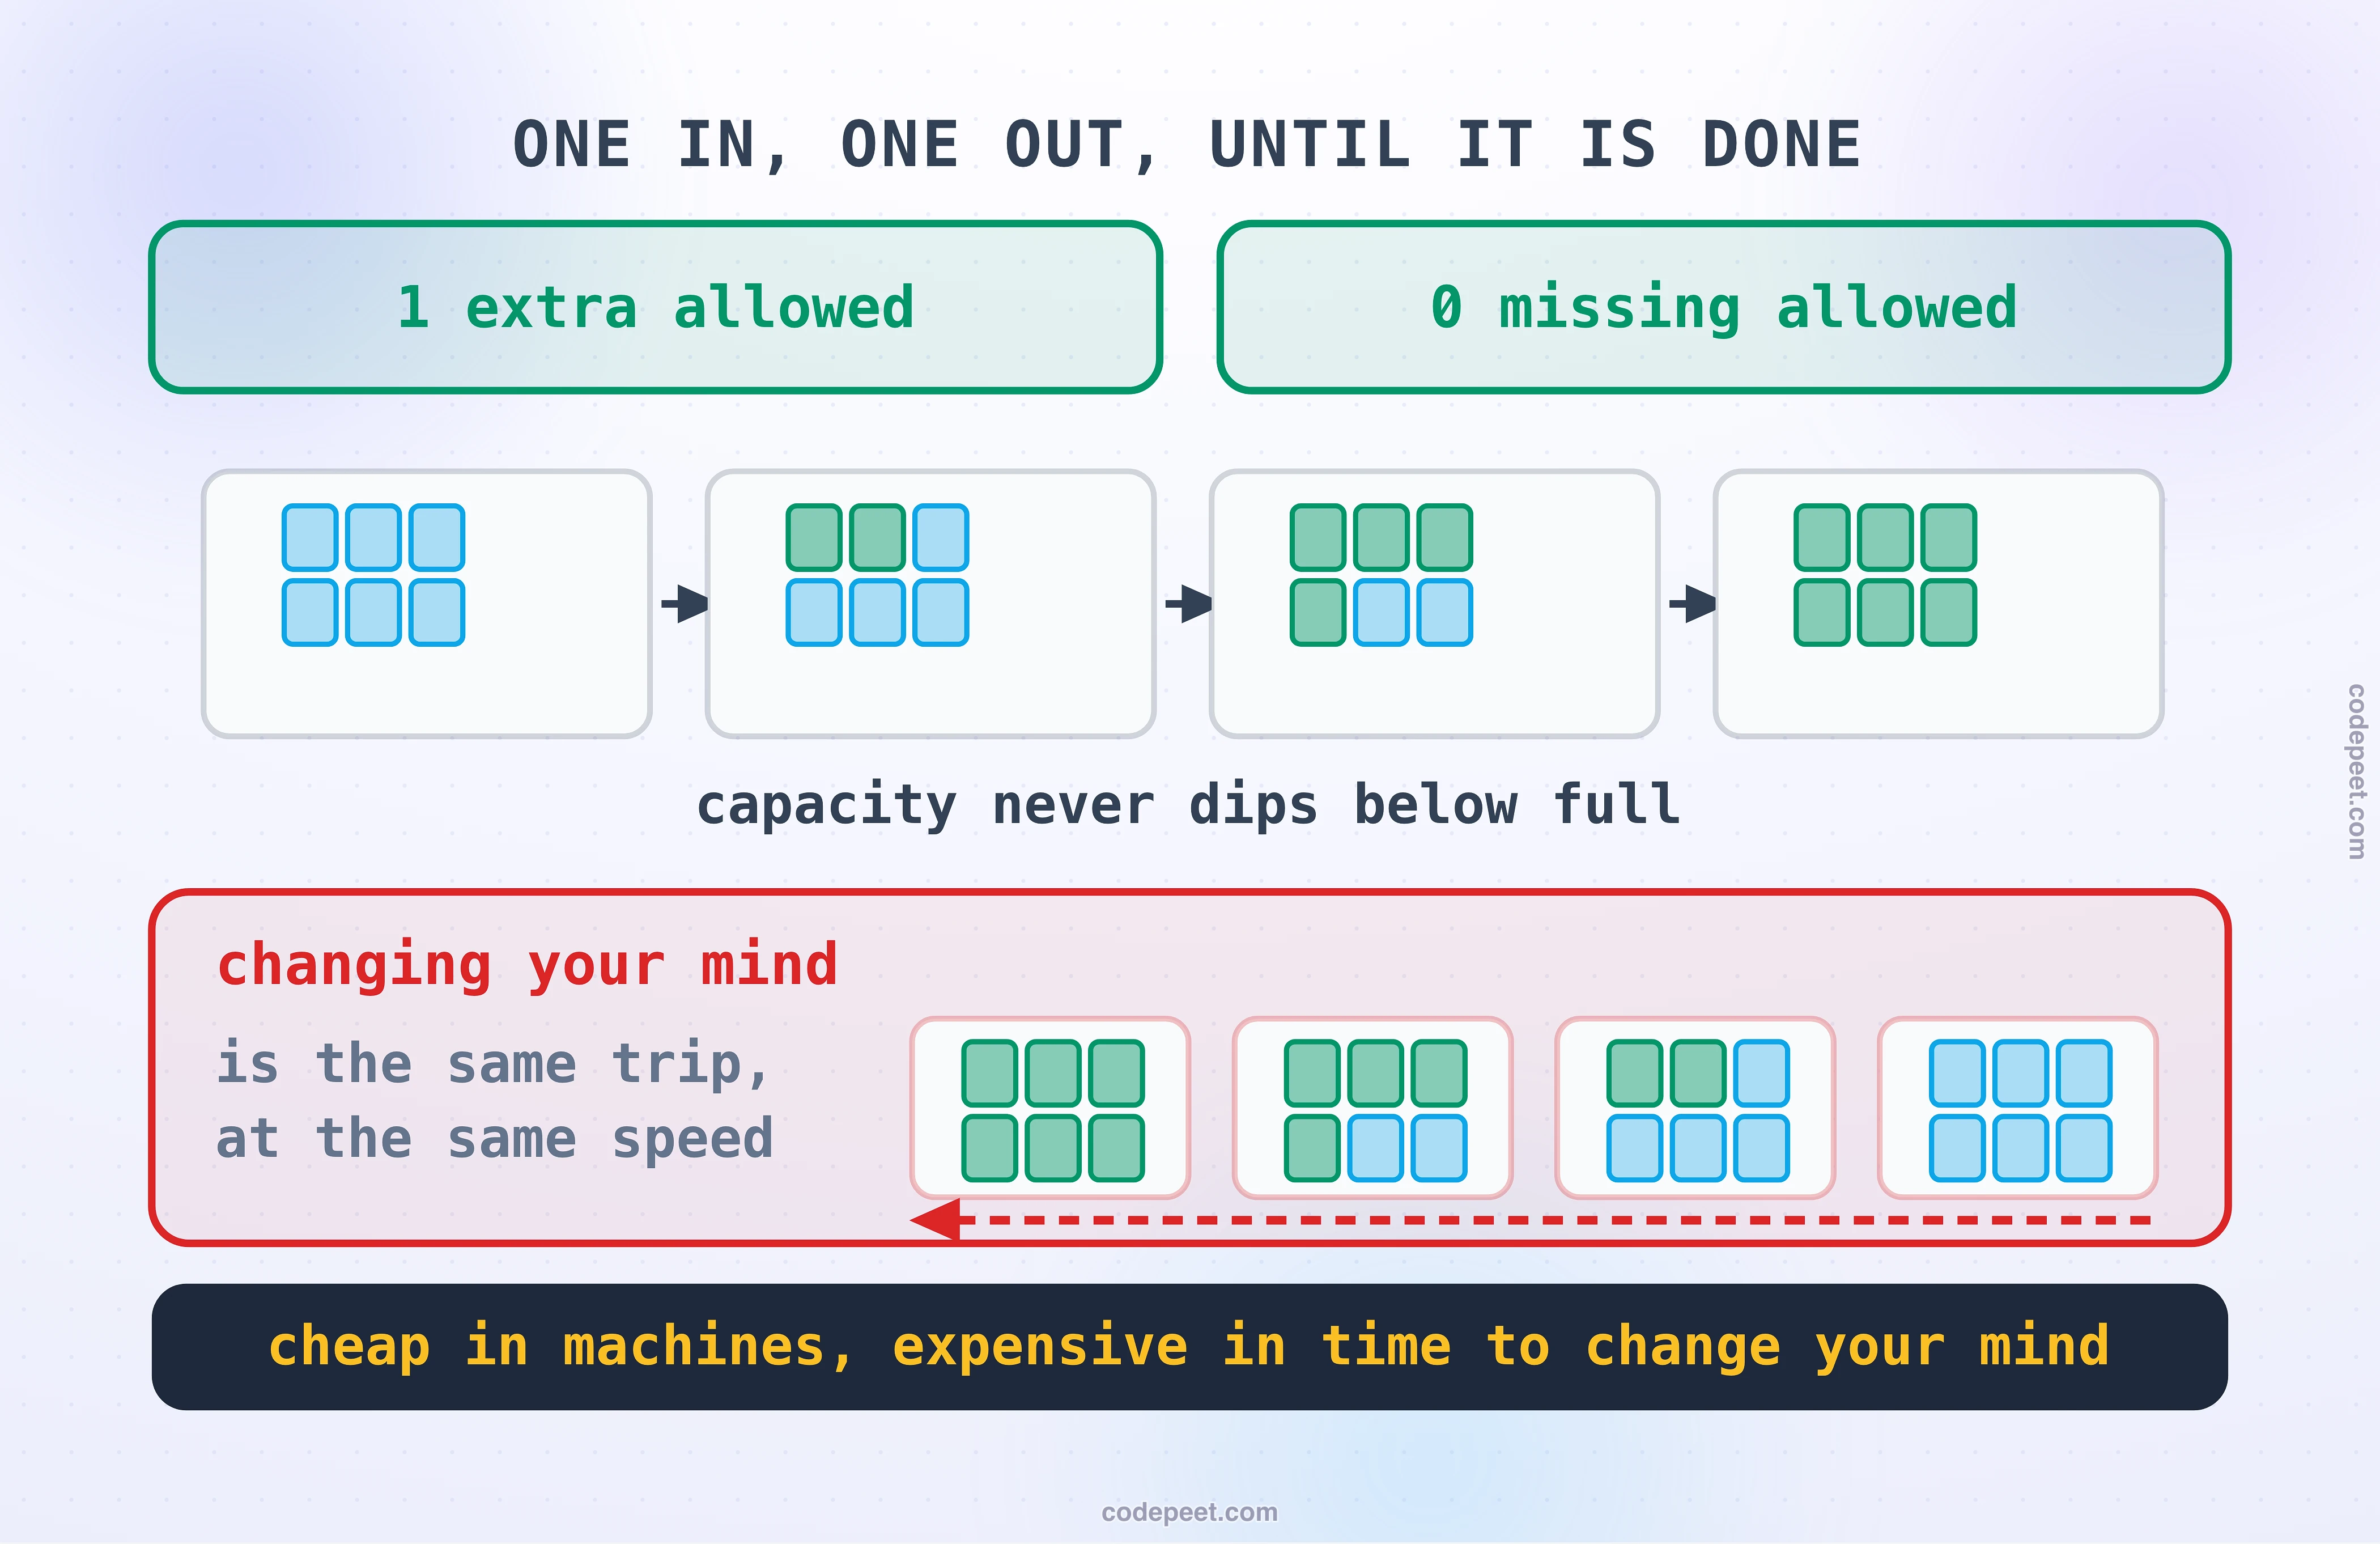
Take a fleet of replicas. Bring up one running the new version, wait until it is genuinely healthy, then take down one running the old version. Repeat until the fleet has turned over. Nobody sees an outage because there is always capacity serving.
Two dials control the whole thing:
- How many extra replicas may exist at once. Room to bring new ones up before old ones go down.
- How many may be missing at once. How far below full capacity you will allow the fleet to dip.
maxUnavailable: 0     # never dip below full capacity
maxSurge: 1           # one extra replica at a time
That pairing is the safe default and worth understanding rather than copying. With zero unavailable, a replacement must be up and healthy before its predecessor is allowed to leave, so serving capacity never drops. With a surge of one, you are only ever paying for a single extra replica. Turn the surge up and the rollout goes faster and costs more while it runs. Allow some unavailability and the rollout gets cheaper and briefly leaves you thinner than you planned, which is a fine trade at three in the afternoon and a terrible one during a traffic peak.
Now the part that matters more than the dials. A rolling update has no undo button. Rolling back is just another rolling update in the other direction, so if the rollout took eleven minutes, so does the recovery. For a change that turns out to be badly broken, those eleven minutes are spent with a fleet that is part-broken and getting no better.
The other thing rolling gives you for free, whether you wanted it or not, is a fleet running two versions simultaneously for the whole rollout. Any request may hit either one. We come back to what that demands.
Blue-Green: Build the New One Beside It
If the problem with rolling is that changing your mind is slow, blue-green solves exactly that and charges you for it.
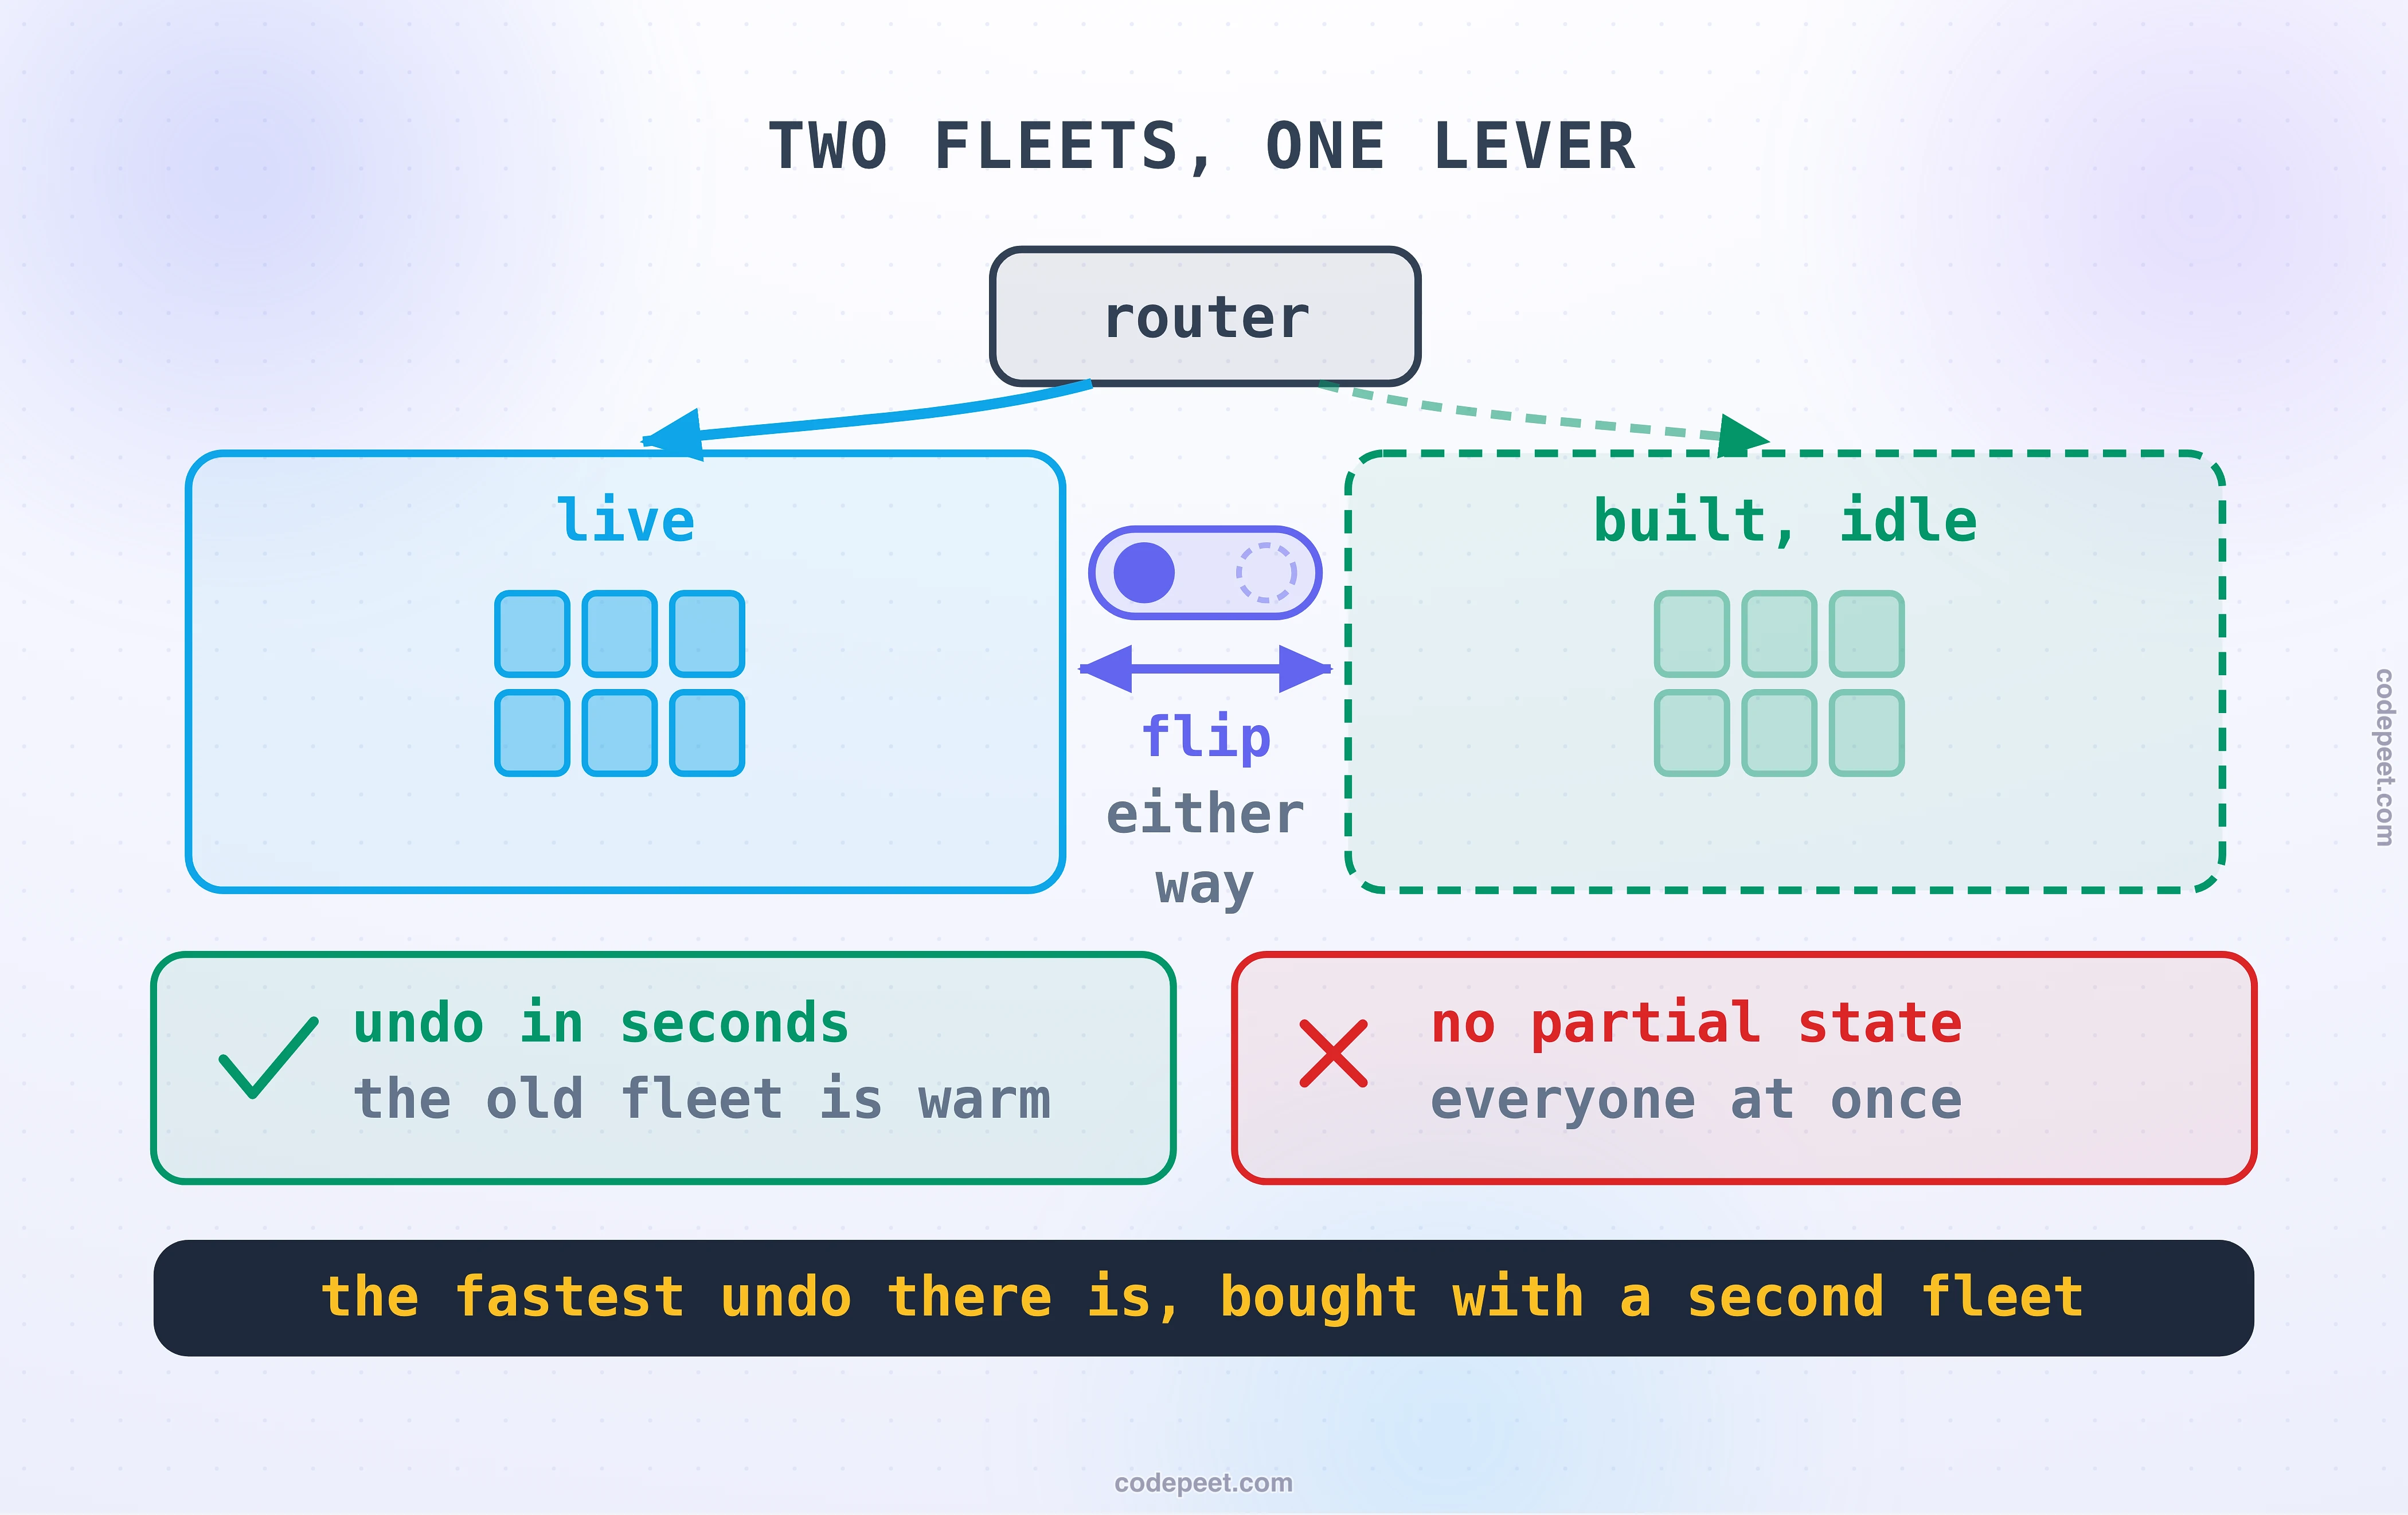
Stand up a complete second environment running the new version. Not a replica or two, the whole thing. Let it warm up. Test it properly, with real checks against the real thing, while it serves no users at all. When you are satisfied, move the router so all traffic goes to the new environment. The old one stays running, idle, doing nothing.
What you buy is the best rollback in deployment: move the router back. Not a rollout, not eleven minutes, a single switch. The old environment is still sitting there, warm and correct. For a genuinely alarming release, being able to undo it in seconds rather than minutes is worth a great deal.
What you pay is equally clear. You are running two complete fleets for the duration of the release. At small scale that is a rounding error. At large scale you are doubling the infrastructure bill of your biggest service every time you ship, and if you ship often, that is a real number that a finance team will eventually ask about.
There is a subtler cost that gets less attention. The switch is all or nothing. Everyone moves at the same instant, so a defect that your testing did not catch reaches one hundred percent of your users immediately. Blue-green gives you a superb recovery from a bad release, and does nothing whatsoever to reduce how many people met it. It shortens the outage; it does not shrink it.
Which is the exact gap the third strategy exists to fill.
Canary: Let a Few Users Meet It First
The name comes from the bird taken into coal mines, and like most borrowed metaphors it is half right. The useful definition is more careful, and the wording repays attention:
A canary is a partial and time-limited deployment of a change, and its evaluation.
Three clauses. Partial, so only some traffic is exposed. Time-limited, so it ends in a decision rather than drifting. And its evaluation, which is the clause teams quietly drop, leaving them with a deployment that is merely slower rather than safer.
Mechanically it is simple. Deploy the new version alongside the old. Send it a small share of real traffic, commonly five to ten percent. Watch. If it looks fine, widen the share and watch again. If it does not, send that share back to the old version, which never went anywhere.
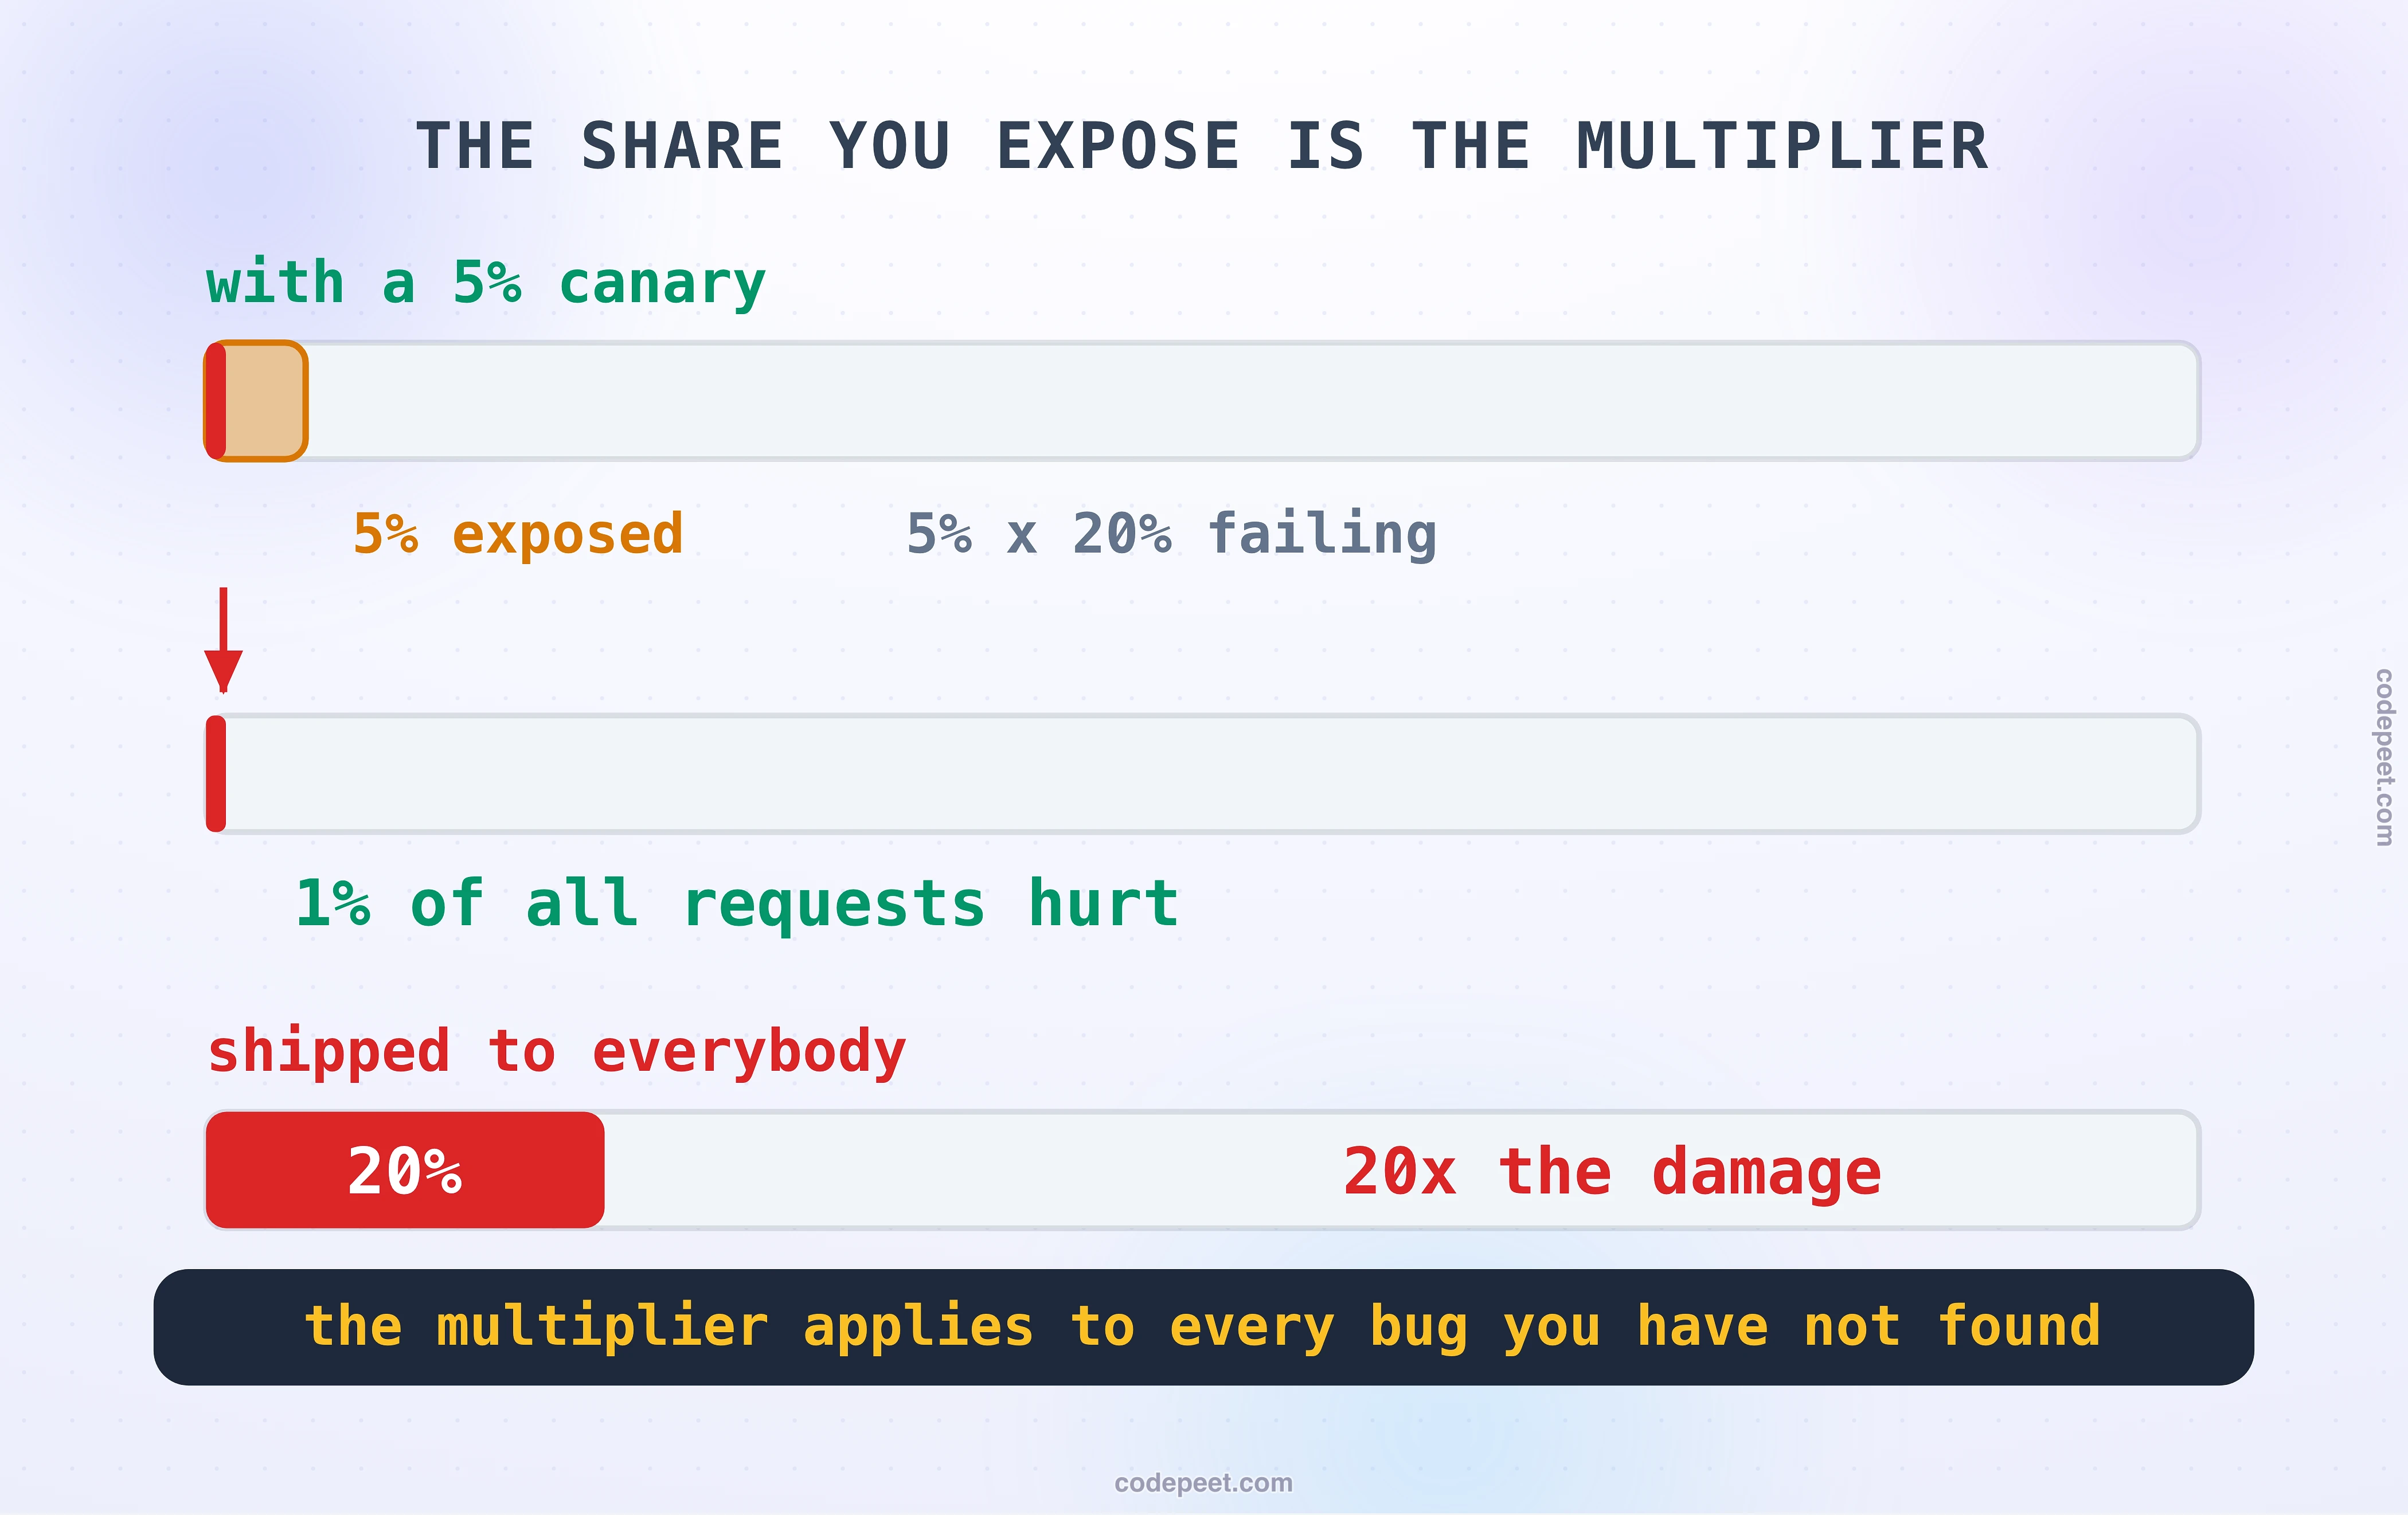
Now the argument for it, which is arithmetic rather than opinion. Suppose a release is badly broken and fails one request in five. If you send it five percent of traffic:
5% of traffic x 20% failing = 1% of all requests affected
Against the alternative of shipping it to everybody, where twenty percent of every request fails, that is twenty times less damage for the same defect. The share of traffic you expose is a straight multiplier on every mistake you have not found yet.
That is a good enough argument that the obvious conclusion is to make the canary tiny. One percent. A fraction of a percent. Minimise the multiplier.
That conclusion is wrong, and the reason is the most interesting thing in this lesson.
A Canary Can Be Too Small to Tell You Anything
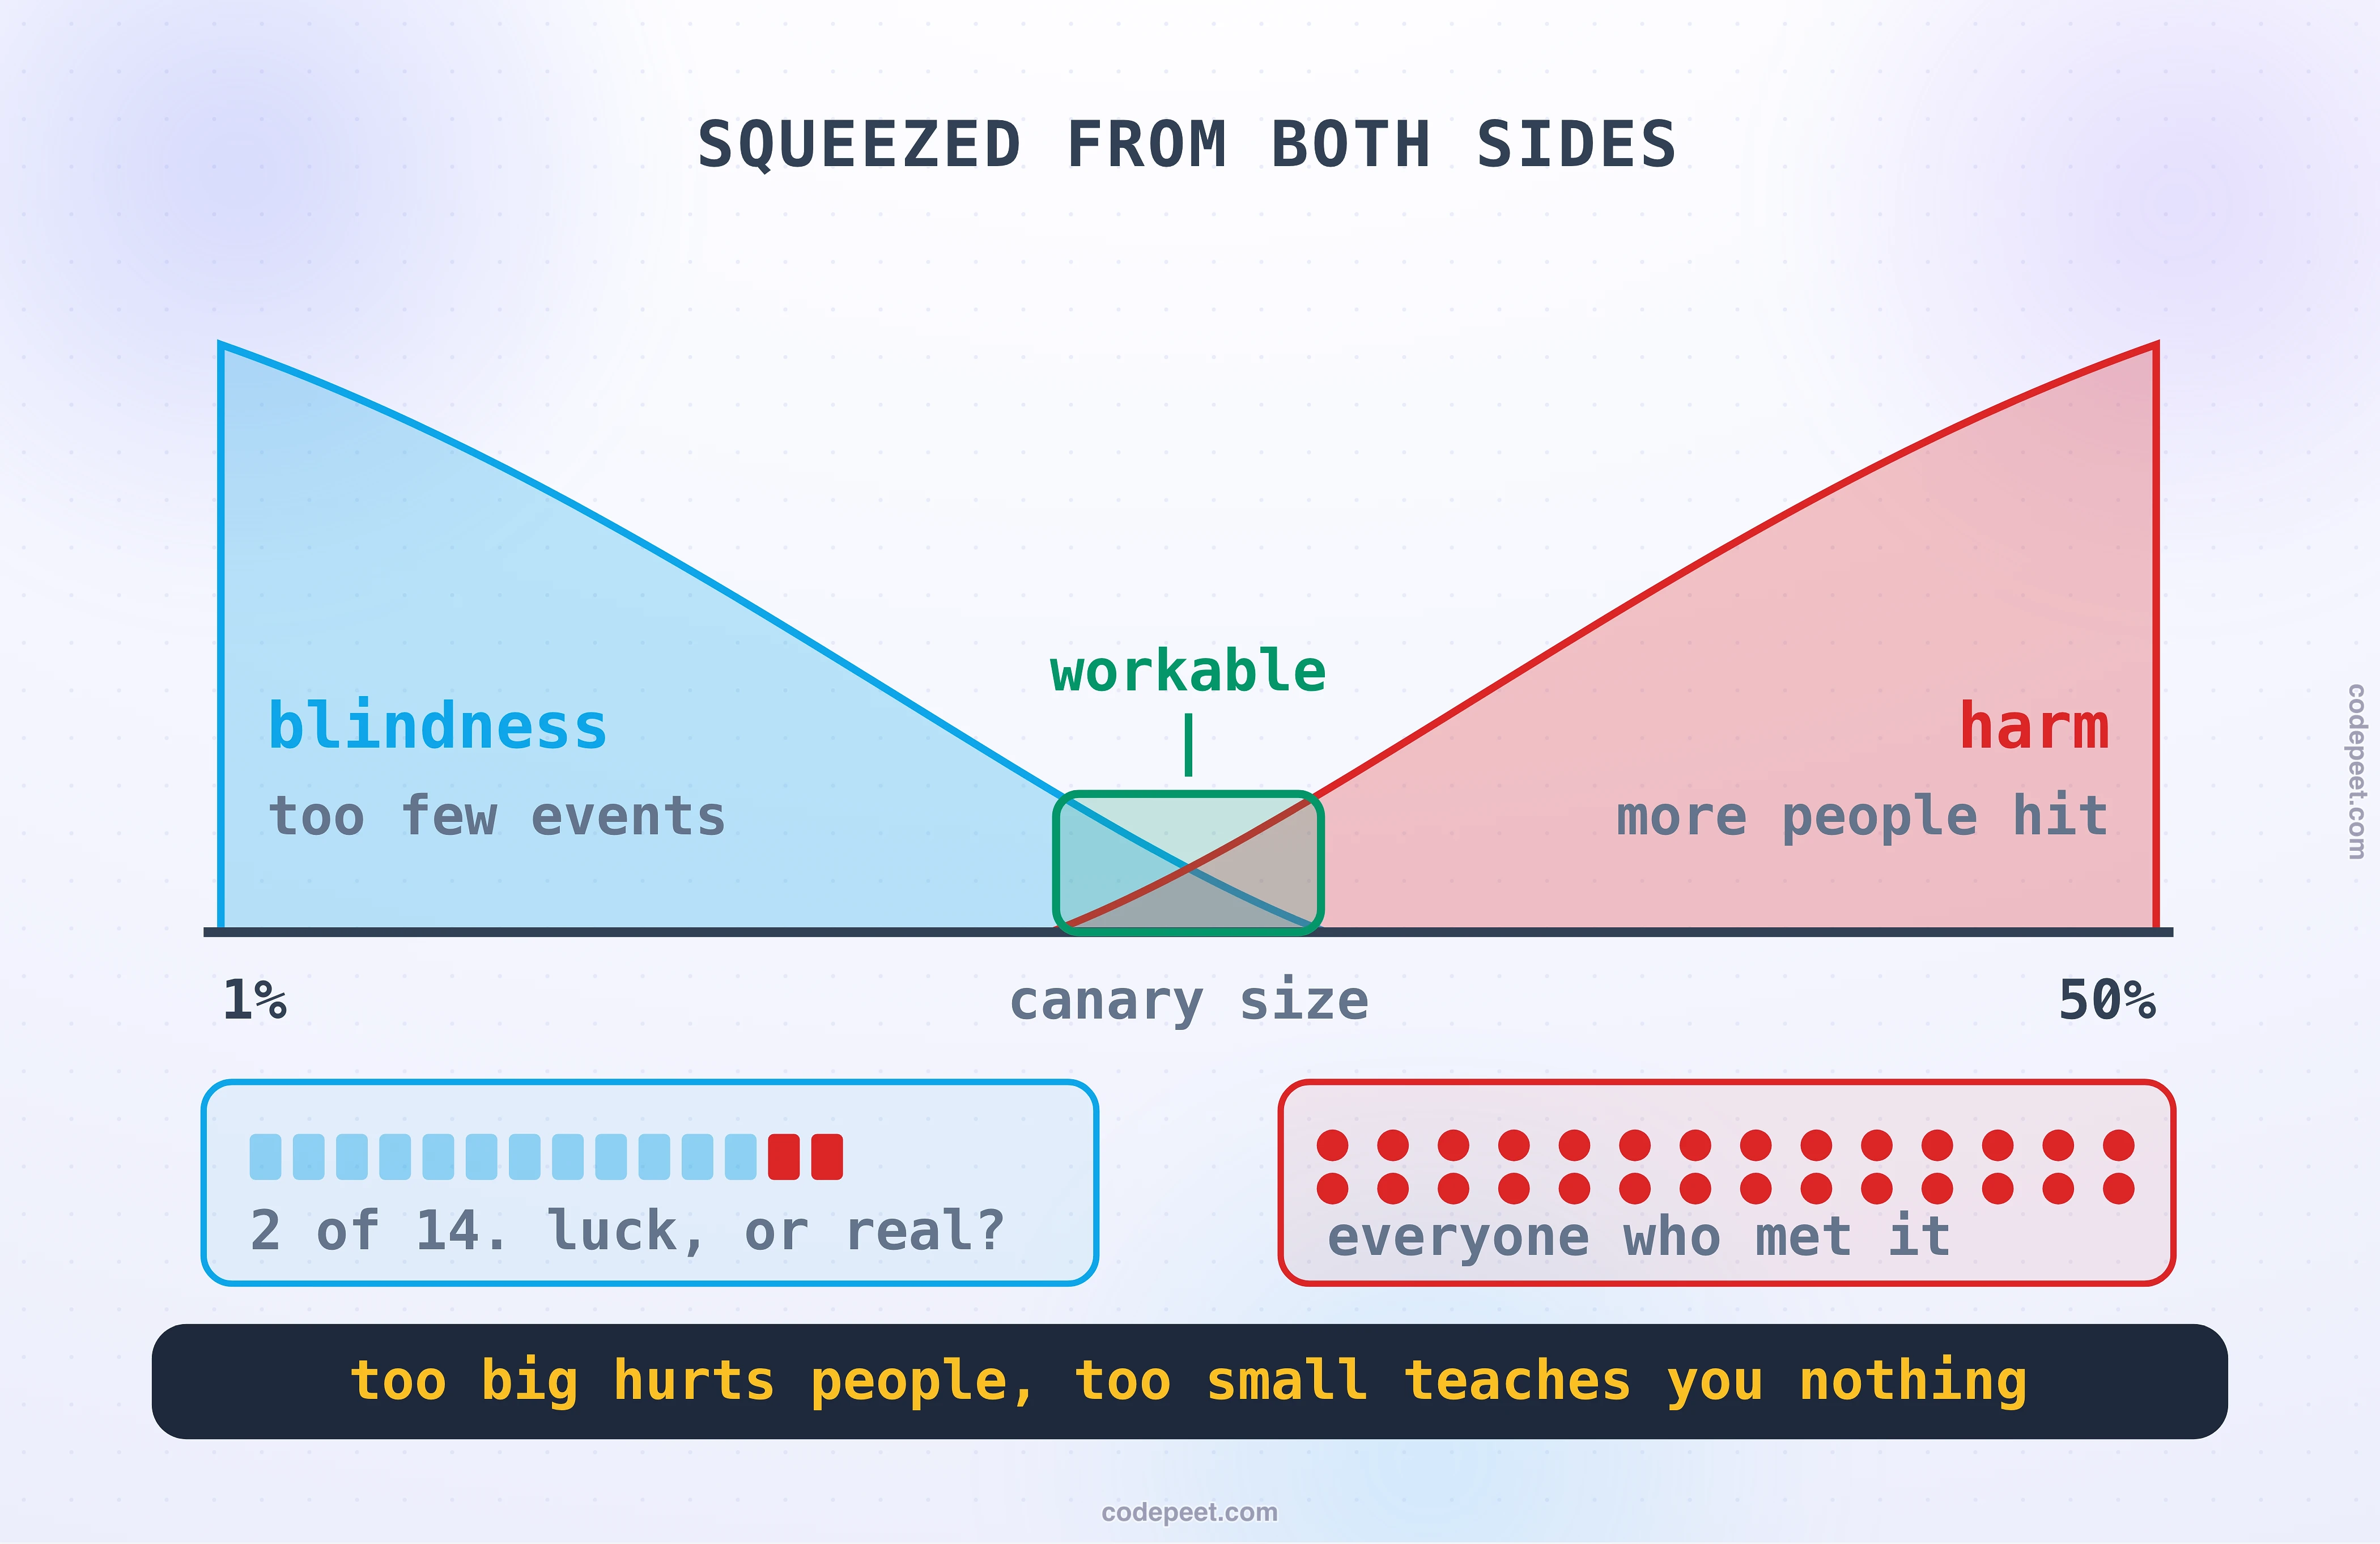
Shrinking the canary reduces the harm. It also reduces the evidence, and those two move together in a way that has a floor.
Here is the problem stated plainly. A canary's job is to answer a question: is the new version worse than the old one? You answer it by comparing what happens to the canary against what happens to everybody else. But error rates are noisy. A service with a healthy baseline still has bad minutes: a slow dependency, an unlucky burst, a retry storm somewhere upstream. The question is never whether the canary saw errors. It is whether the canary saw enough more errors than the control that luck is an implausible explanation.
That is a statistical question and it is answered statistically. Automated canary analysis tools, of which Netflix's open-source Kayenta is the best known, compare the two groups with a non-inferiority test, typically the nonparametric Mann-Whitney U, and report whether the difference clears a confidence threshold. The framing is worth borrowing even if you never run the tooling: the question is not is the canary good, it is is the canary not-worse than the control, and am I confident enough to say so.
And that depends entirely on how many requests you gathered.
Work an example. A service handling 200 requests a second, a canary on 1% of traffic, watched for five minutes. That canary saw around 600 requests. Suppose the new version genuinely fails an extra 2% of the time, so it caused roughly twelve extra failures. Twelve. Against a baseline that already produces failures on its own, and a sample small enough that a handful either way is entirely ordinary. No honest analysis will call that a regression, because from six hundred requests it genuinely is not distinguishable from a slightly unlucky five minutes.
So the canary passes. The release is promoted. The regression is real and now goes to everybody.
This is the part worth carrying: a canary that is too small does not fail safe. It fails silent. It does not report uncertainty, it reports a pass, and a pass looks exactly like good news.
Which means canary size is squeezed from both directions.
- Too large and the multiplier from the previous section bites: more people meet the defect.
- Too small and the signal disappears into the noise, and you have bought the ceremony of a canary without the protection.
The professional statement of this is that larger canary populations reduce variance in the signal but cost more resources and more time, while smaller ones reduce clarity and make defects harder to detect. Both halves are true simultaneously, and the useful range sits between them.
The practical escape is usually not a bigger percentage but more requests, which you get from time. If you cannot expose more traffic, watch for longer. And if the service is too quiet for either to produce enough events, be honest that the canary is theatre for this service and rely on something else, because for genuinely low-traffic services the arithmetic simply does not work. As a reference point, teams running mature automated canary analysis look for something on the order of thousands of requests per minute per instance before they trust the verdict.
Go and find the silent failure yourself. It is more convincing than reading about it.
Compare Against Now, Not Against Yesterday
Two questions follow immediately: how long do you watch, and what exactly are you comparing against?
How long. The watching period has a name, the bake, and there is no universal number for it. There are two rules that pin it down.
The bake must outlast one unit of work. If a request takes 200 milliseconds, seconds may do. If your service runs jobs that take twenty minutes, a five-minute canary has not seen a single complete job and cannot have an opinion about them.
It must also align with how your metrics are aggregated. If your error rate is computed over one-minute windows, a ninety-second canary gives you roughly one usable data point, which is not a trend.
Beyond that, release velocity sets the rest. Teams shipping several times a day cannot afford hour-long canaries, and teams shipping weekly cannot afford not to.
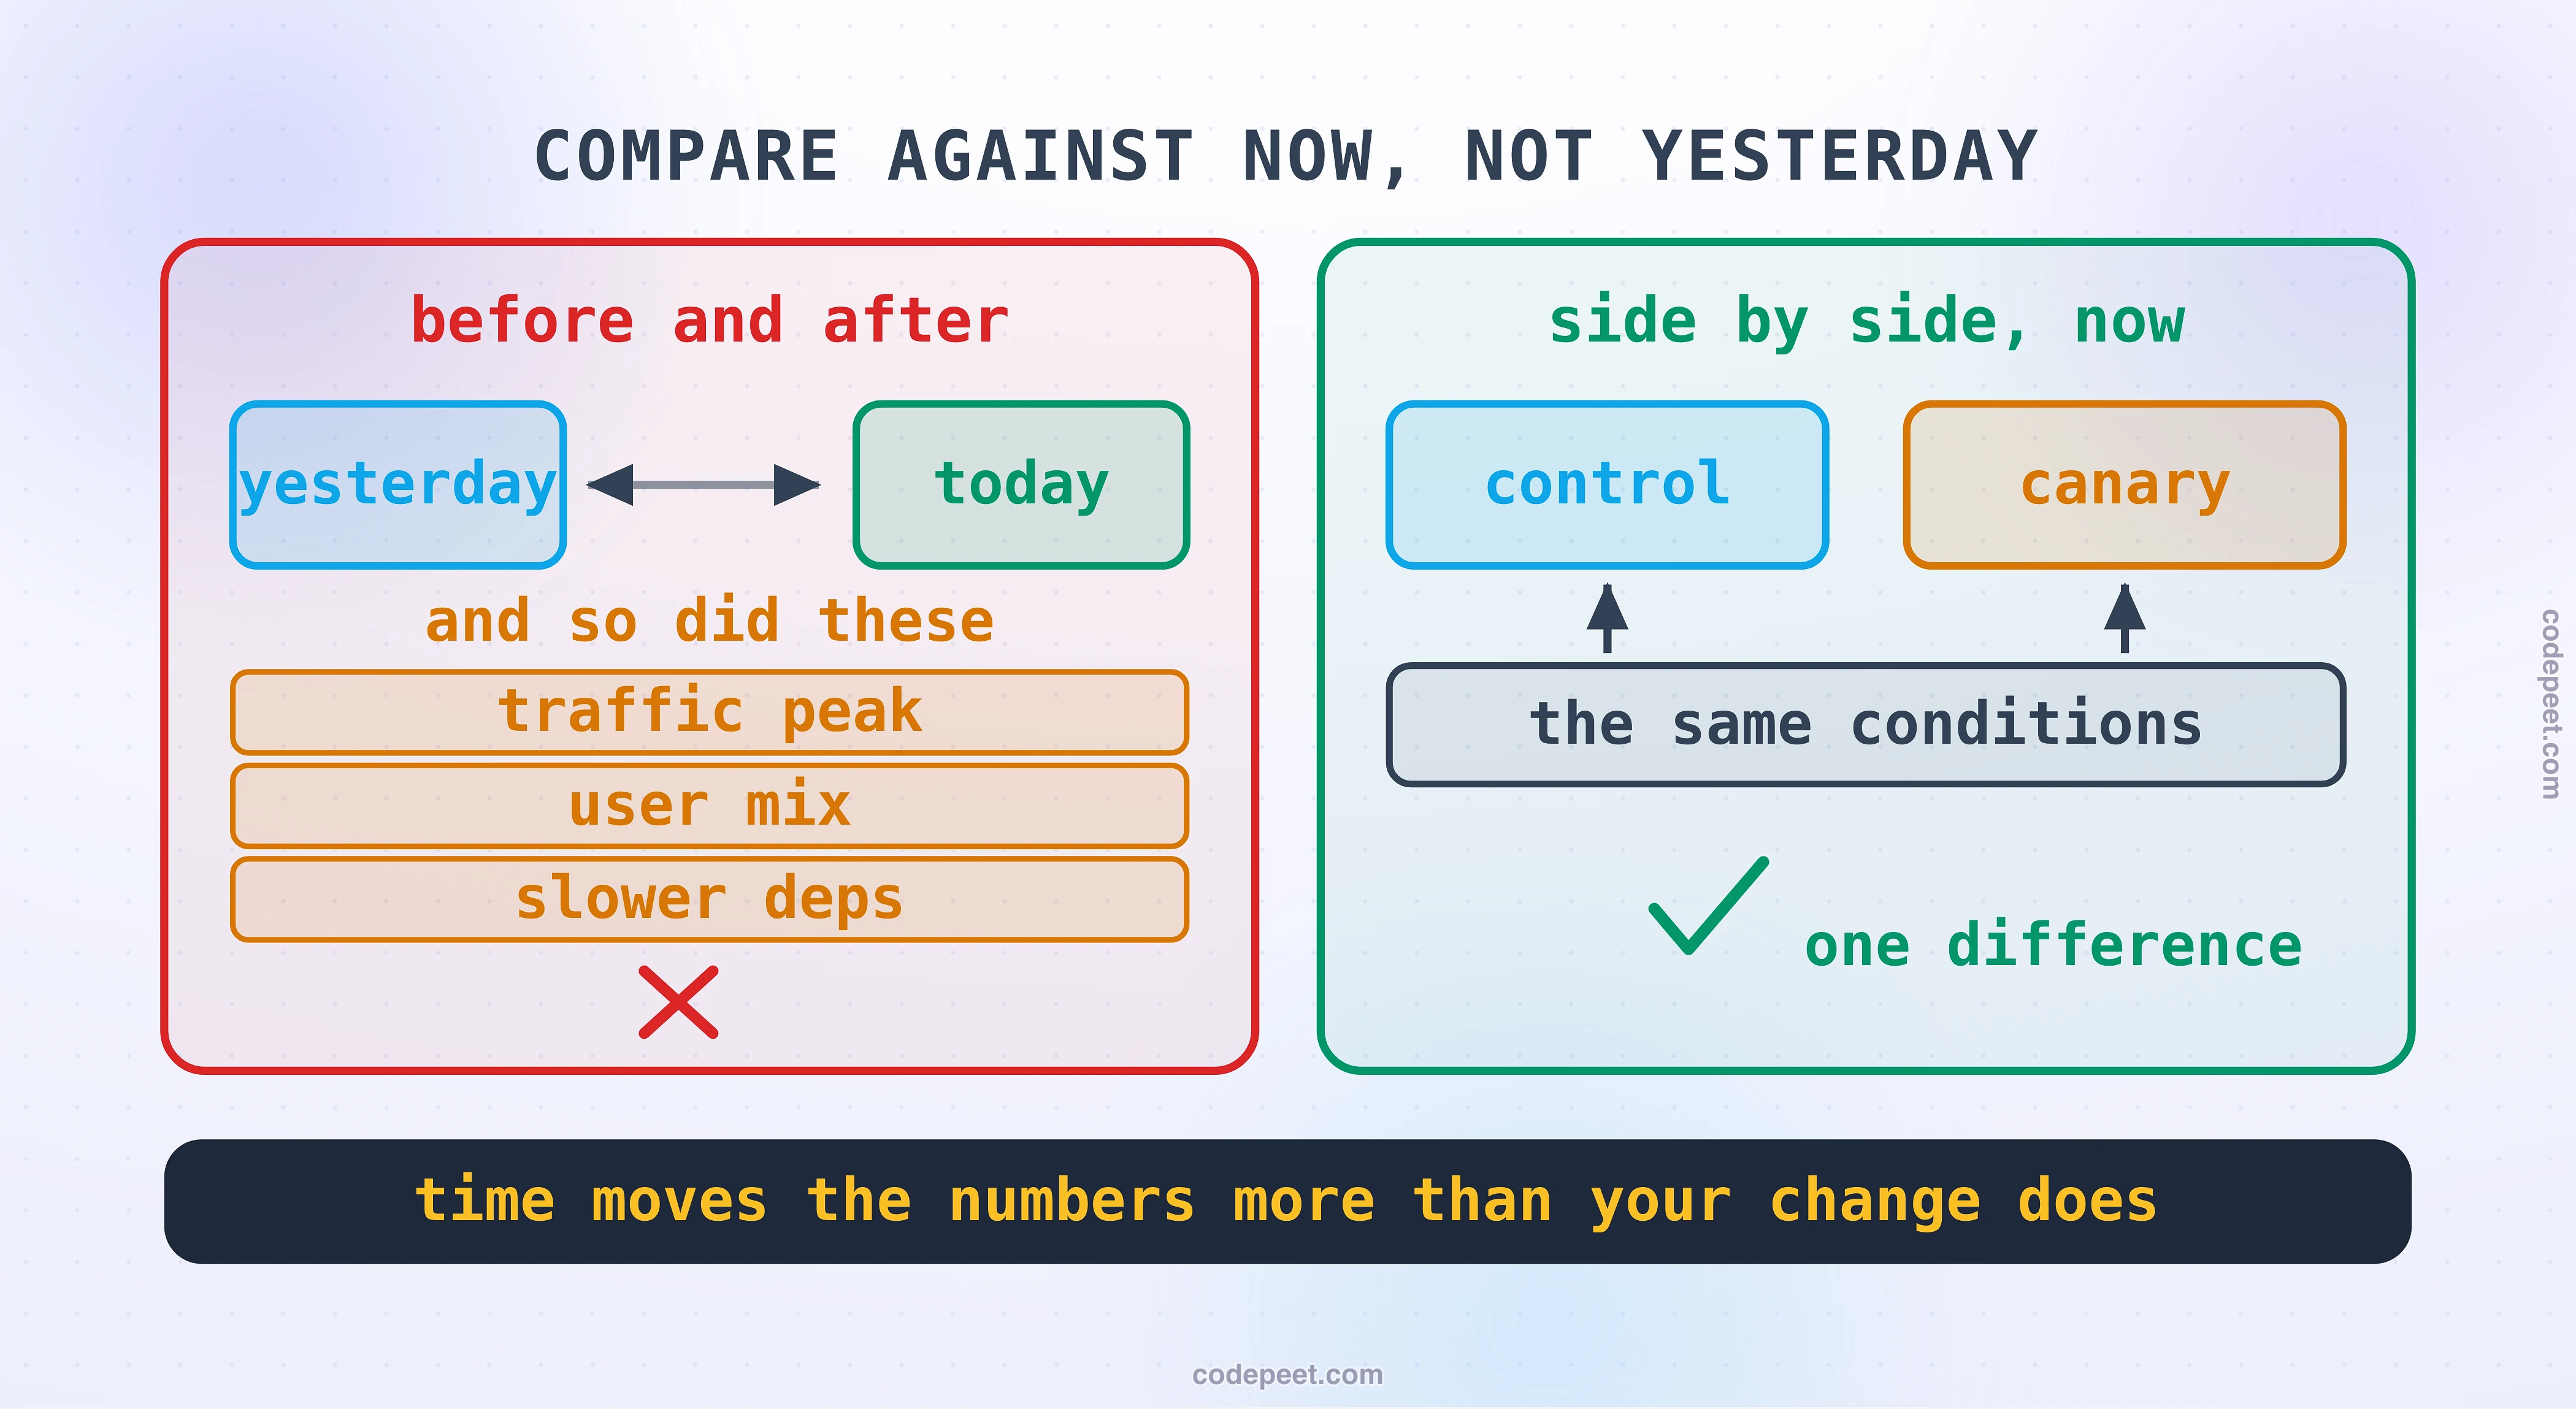
Against what. This one has a wrong answer that looks reasonable and is very common: compare the new version's numbers now against the old version's numbers from before the deploy.
Do not. Time is one of the biggest sources of change in observed metrics. Between yesterday and now, traffic volume changed, the mix of users changed, a dependency got slower, a cache warmed up, a batch job started. Any of those will move your error rate or latency by more than the regression you are hunting, and you will not be able to tell which effect you are looking at.
Compare the canary against a control group of the old version running at the same moment, ideally the same size, taking the same kind of traffic through the same conditions. Then everything that changed in the world changed for both of them, and the difference that remains is much more likely to be the thing you actually changed.
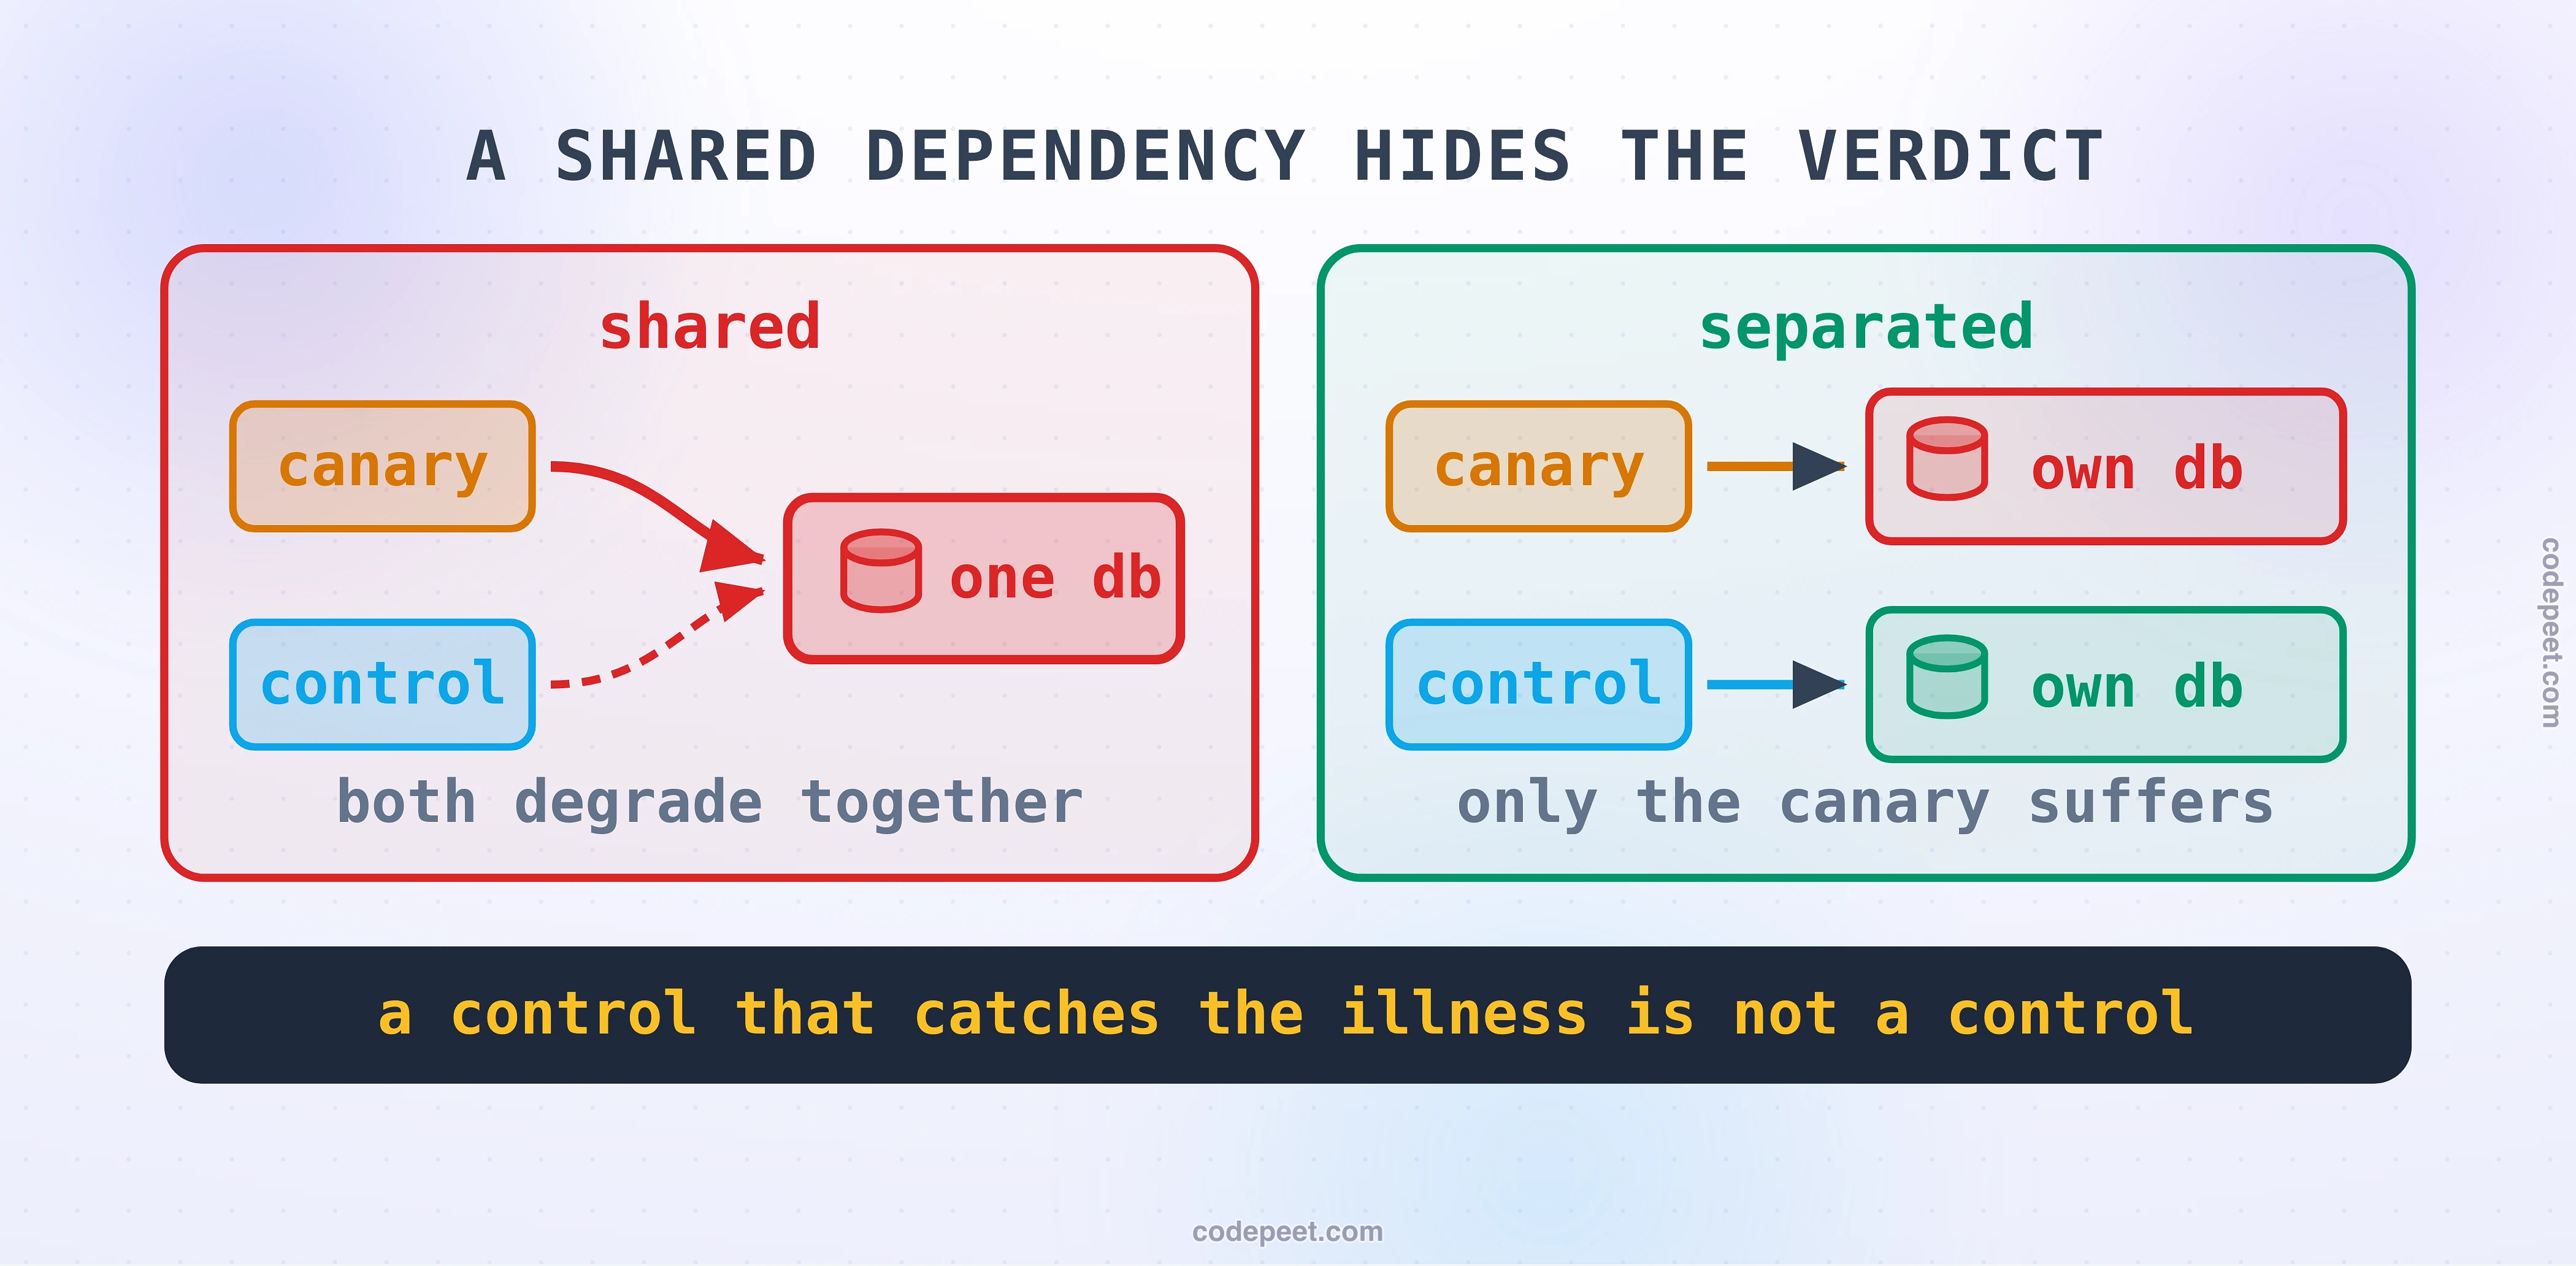
One trap even then. If the canary and the control share the infrastructure that the canary is breaking, a sick canary drags the control down with it, both look equally bad, and the comparison quietly stops meaning anything. A canary hammering a shared database will make the control's latency look just as poor as its own.
As for what to compare: error rate and latency are the obvious pair, but the ones that catch real regressions are usually closer to the business. Checkouts completed. Sign-ins succeeded. Items actually added to a cart. A release can keep every technical indicator green while quietly halving conversion, and no amount of comparing five-hundreds will notice.
One trap survives even a correct comparison. If the canary and the control share the very thing the canary is breaking, the damage reaches both. A canary hammering a shared database drags the control's latency down with it, the two groups end up looking equally unwell, and the difference between them, which is the only thing you were measuring, collapses to nothing. The analysis reports no significant difference and it is telling the truth: there genuinely is not one, because you broke both sides.
Where a new version can overload something shared, give the canary its own copy of it, so that the only thing the two groups still have in common is the traffic.
All Three Assume Two Versions Can Coexist
Back to the precondition from the opening, because nearly every painful surprise in this area comes from it.
During a rolling update, both versions serve for the length of the rollout. During a blue-green cutover, both are running even if only one has traffic. During a canary, both serve for as long as you watch. There is no strategy here where the old and new versions do not overlap, which means everything they share has to tolerate both.
The database is the big one. Both versions talk to the same data at the same time, so any schema change has to be readable and writable by the old code as well as the new. A column rename that looks trivial will break every replica that has not been replaced yet, and it will do it during the rollout, which is the worst possible moment. The discipline that solves this is expand-then-contract, and Schema Migrations: Expand-Contract is where it gets taken apart properly. What matters here is the constraint: your deployment strategy is only as flexible as your schema changes allow it to be.
Anything sticky is a problem. A weighted traffic split does not keep a user attached to a version. Consecutive requests from the same person can land on old, then new, then old again. If the new version writes something to a session that the old version does not understand, that user gets a broken experience that nobody can reproduce. You can force stickiness, but it fights the load balancer's whole purpose and unbalances the fleet, so the better answer is usually to stop keeping anything version-specific in a session.
Long-lived connections do not roll. Websockets, streams, long polls. A rolling update replaces the server underneath them, and unless you drain deliberately, you are cutting live connections and stampeding everyone into a reconnect at once.
And the rollback path is the least tested code you own. It gets exercised on the worst day, under pressure, usually for the first time. If reverting depends on a route that nobody has tried since it was written, you do not have a rollback plan, you have a rollback hope. Rollback Strategy is a lesson of its own for exactly this reason.
Which One, and When
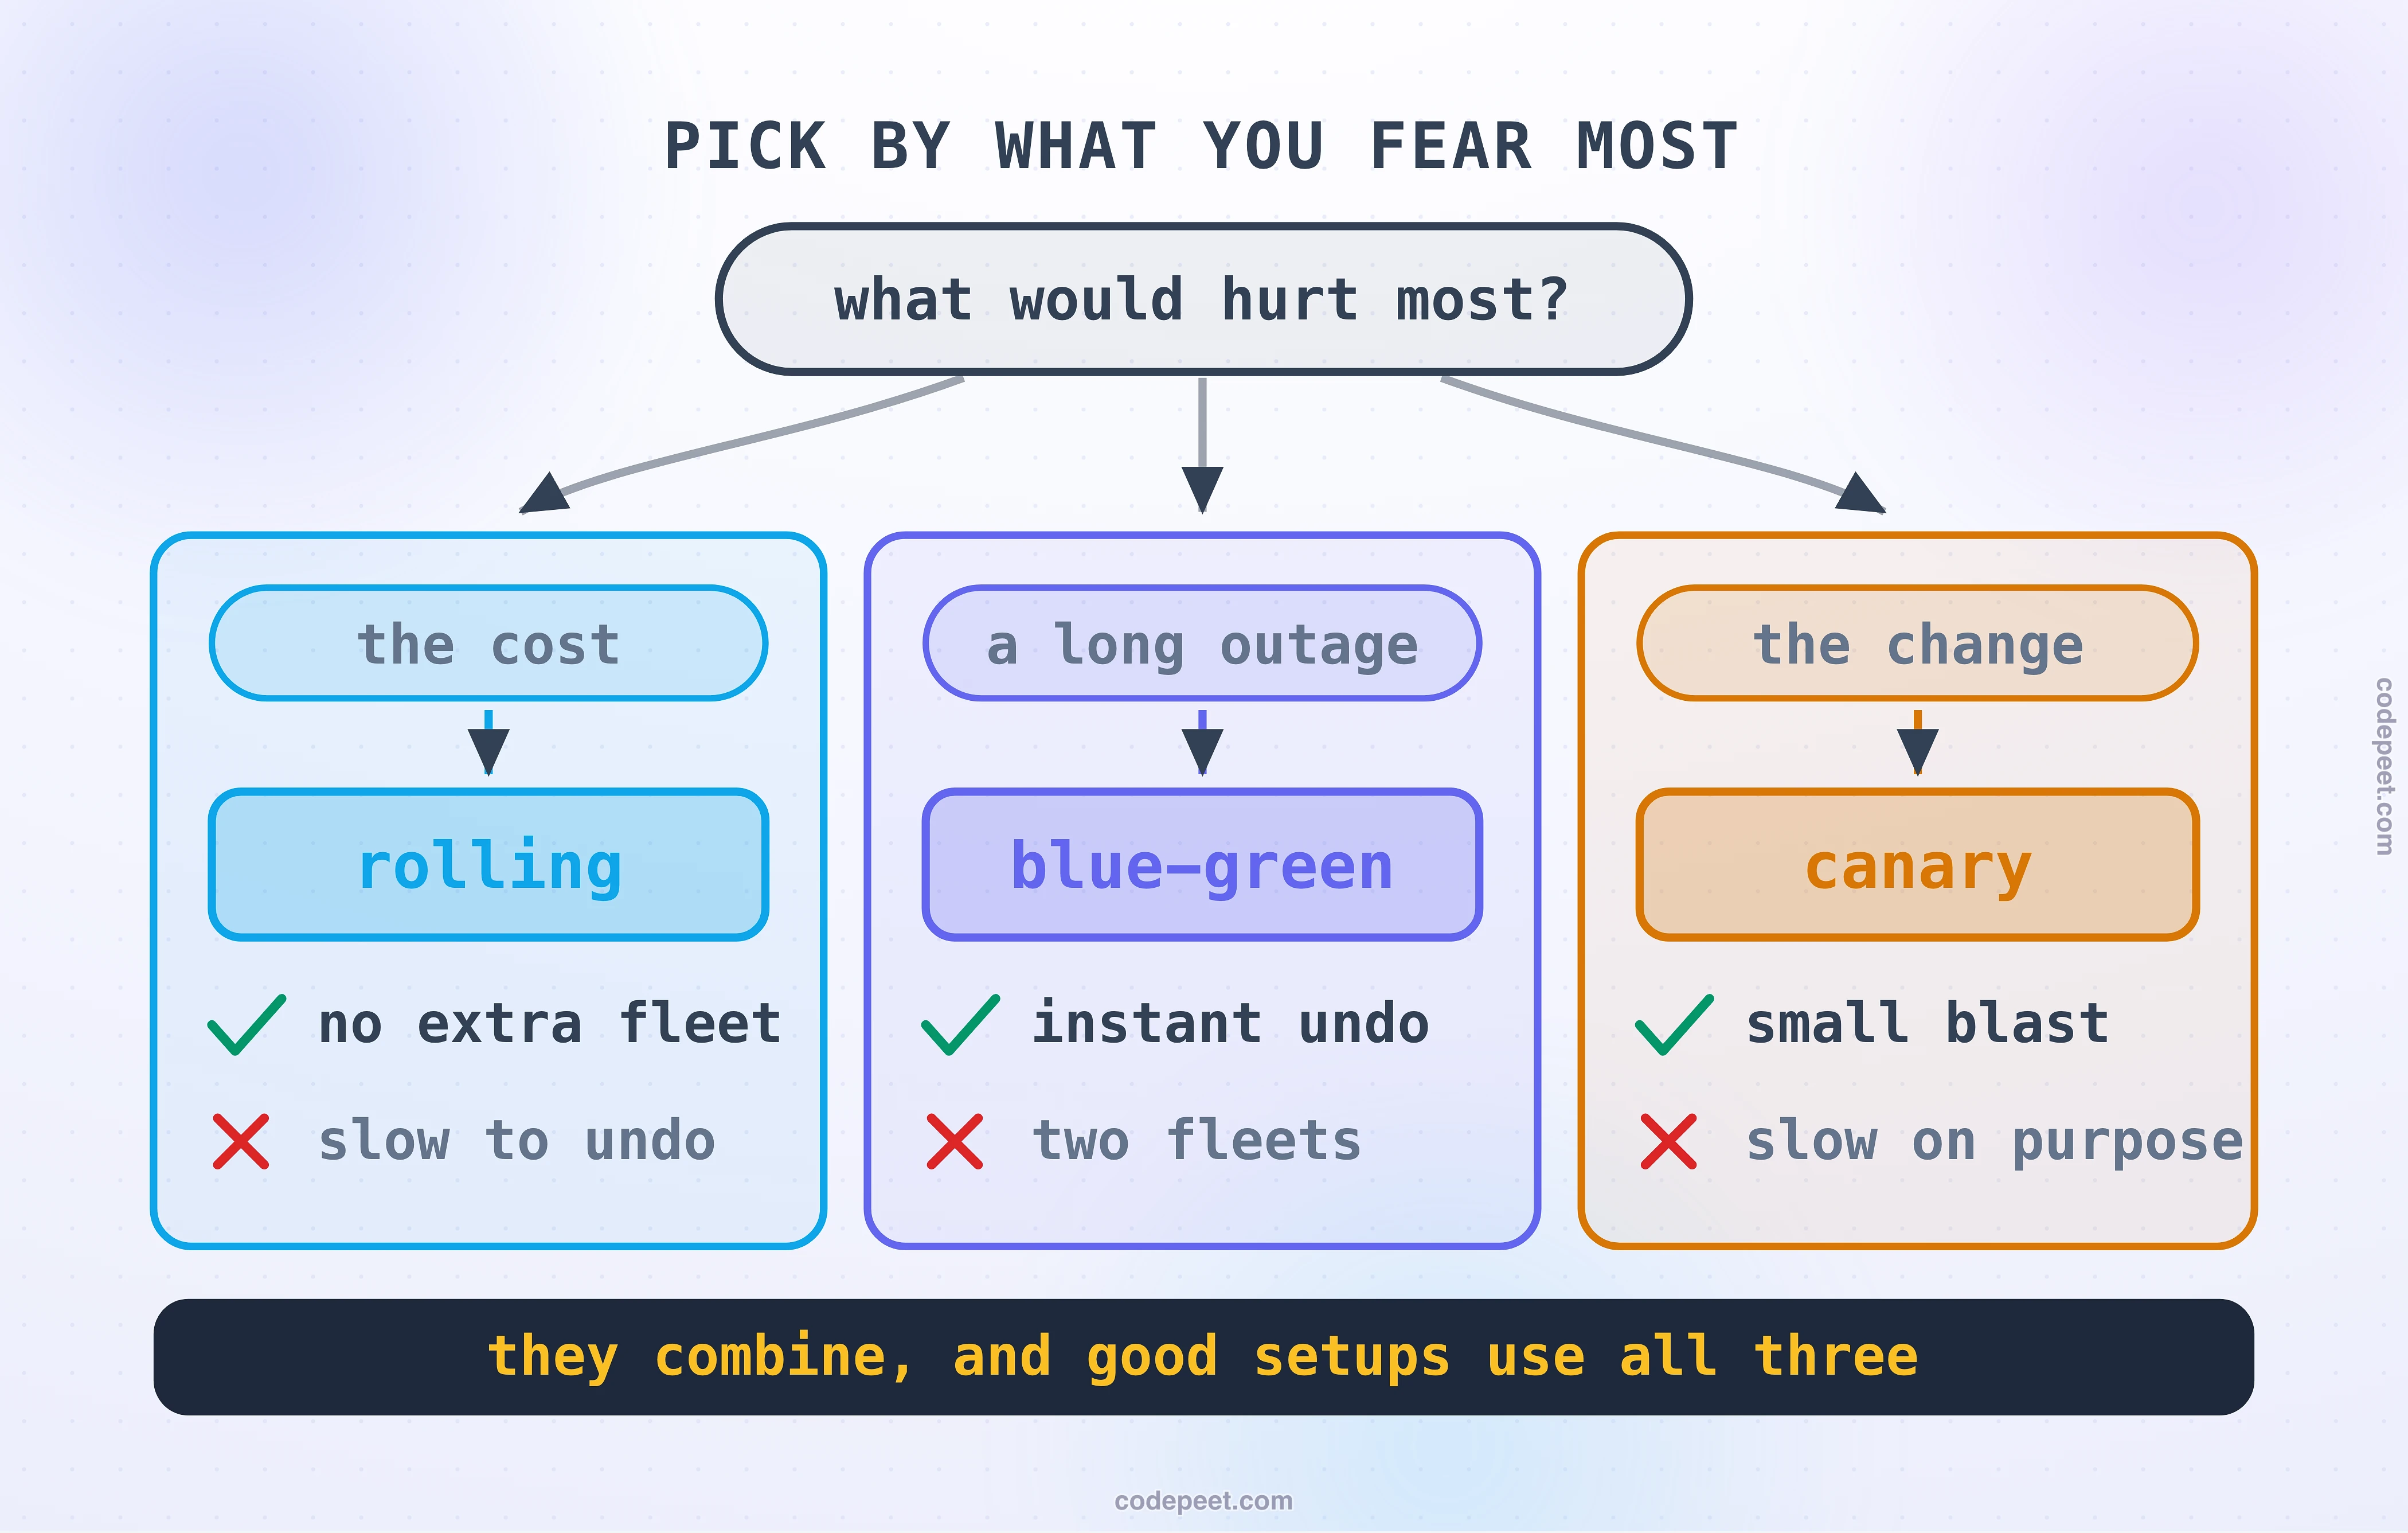
These are not ranked. Reach for the one that matches what would hurt most if you were wrong.
Rolling is the sensible default, and most deployments should be boring rolling updates. No extra fleet, no ceremony, and for the ordinary change that has passed a decent pipeline it is entirely adequate. Accept that undoing it is as slow as doing it.
Blue-green is for when recovery time is the thing you cannot afford. A payment path during a sale. A migration you are not certain about. Anything where the difference between a ten-second recovery and a ten-minute one is the difference between an inconvenience and an incident. You are buying that with a second fleet, so buy it deliberately rather than by default.
Canary is for when you do not trust the change itself. A rewritten core path, a new dependency, a performance change whose effect you genuinely cannot predict from a test environment. It is the only one that limits how many people meet a defect, and it is the only one that demands you decide beforehand what would count as bad. If you cannot say what you would look at and what number would make you stop, you are not running a canary, you are running a slow rollout with extra steps.
They also combine, and in practice the good setups do. A canary that passes is often promoted by an ordinary rolling update. A blue-green cutover can send a fraction of traffic to green before the full switch. And where the system is already divided into independent cells, the deployment can move cell by cell, which gives you a natural blast radius for free. Cell-Based Architecture & Deployment Stamps covers that shape.
One more option worth knowing sits before all of these. If what you want is to exercise the new version under real traffic without any user depending on the result, you do not need a canary at all. You mirror traffic to it and throw the answers away. That is a different tool for a different question, and Shadow Traffic & Dark Launches is where it lives.
The thread running through all of it: every one of these strategies is a way of buying information before you are fully committed. Rolling buys a little, slowly. Blue-green buys none but keeps the exit open. A canary buys the most, and only if you were honest about what you were looking for, and only if you sent it enough traffic to see anything at all.
Which raises the question the next lesson exists to answer. All of this assumes that deploying the code and turning on the behaviour are the same act. They do not have to be, and separating them changes what a deployment even means.